I’ve discussed the importance of race-day pacing in two prior articles. In those pieces, we established that proper management of our effort prevents glycogen depletion, late-race fading, and a DNF. Knowing ahead of time how long it should take us to travel between points on a course is a key component to helping us maximize our capabilities. This information will dictate our training, nutritional requirements, the timing of our crew or pacers, trail illumination needs, and provide race-day reassurance. A practical pacing plan will answer questions like:
- How long will it take me to complete the event?
- Is there a way to determine my splits between aid stations?
- What can I do in training to prepare for the specifics of this race?
- Where will I need a headlamp?
But how do we create this framework when an ultramarathon race’s length and the expansive terrain it crisscrosses are so overwhelming? By doing a little research on the internet, any runner, no matter their experience or ability level, can develop and benefit from a pacing plan. Follow this methodology to clearly define your race-day pacing strategy. For the purposes of this exercise, I’ve selected the Silver State 50 Mile as the goal race.
Tools needed:
- The event website with course map, aid-station information, elevation profile, and past results.
- Result-storage databases like UltraSignup, RealEndurance, the International Trailrunning Association’s (ITRA) Performance Index, or Run100s.
- Access to free GPS running watch-compatible athletic-tracking platforms like Garmin Connect or Strava.
Step 1: Do your due diligence.
Scour the event website and familiarize yourself with the race’s defining characteristics:
- Study the general layout of the course and the profile’s silhouette. Note any loops, out-and-backs, altitude, net-elevation gain, and locations and lengths of the major climbs and descents. See Figure 1.
- Plot aid-station locations against the profile’s outline. This will reveal terrain like valleys, ridges, and mountaintops you’ll face between checkpoints. See the bottom half of Figure 1.
- Determine distances between aid stations. These mileages, along with the topography gleaned from above, will provide you an initial glimpse of how long it may take you to get from point ‘a’ to ‘b.’ See Figure 2.
- Learn accessible crew, pacer, and drop-bag locations. Not every checkpoint allows crew and/or drop bags. For example, Silver State allows crew only at the River Bend Aid Station at mile 33. This will be crucial information when determining your placement of special nutrition or equipment needs. See Figure 2.

Figure 1. Silver State 50 Mile course map and elevation profile with aid-station locations included. All images are screenshots.
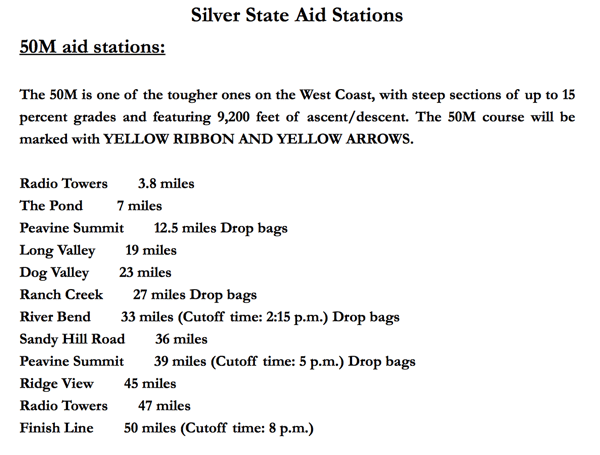
Figure 2. Silver State 50 Mile aid-station distances, net gain, drop bag, cut-off information.
Step 2: Estimate your overall finishing time.
Examine previous results and compare yourself against past performers, who we’ll now call ‘avatars,’ of a similar ability level. Do this by selecting avatars that have similar finishing times in other events you’ve completed. Their performances in your goal race will establish your likely finish time. Use a large avatar sample size to account for anomalous data. UltraSignup may be the easiest tool for cross-referencing other runners’ performances with your own. See Figure 3.
For example, before last year’s Silver State I determined that I had a good shot at finishing in less than nine hours due to the past performances of Eric Skaden, Denise Bourassa, Charles Hofacker, and Sean Meissner (among others)—athletes who usually finish around the same time as I do in other events of this distance and terrain. Consider using RealEndurance or Run100s for older race results or ITRA’s Performance Index for European event results.
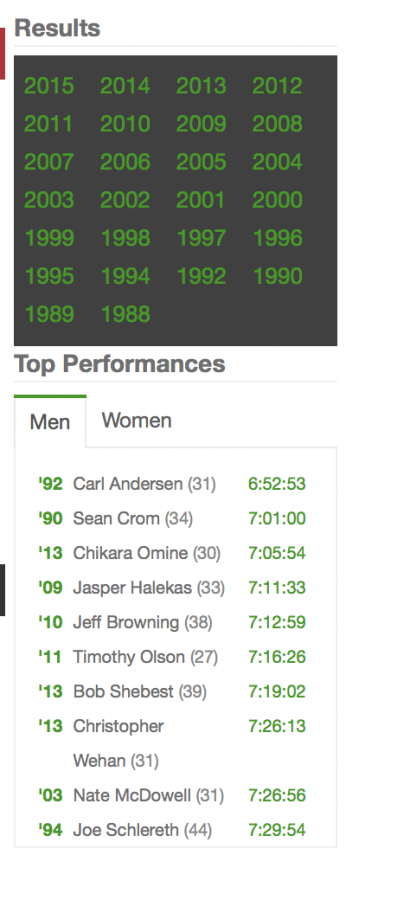
Figure 3. UltraSignup has many years of Silver State 50 Mile finisher data.
Step 3: Compile your avatars’ race splits.
If you’re lucky, your race might include splits on its website, like the Western States or JFK 50 Mile. A handful of race splits from some well-known events are also collected in databases like UltraSplits (Figure 4) or UltraLive.net (Figure 5).

Figure 4. Race splits for the Western States 100 collected from UltraSplits. This figure shows only the top finishers, but all finisher splits from 2012 to present are available.
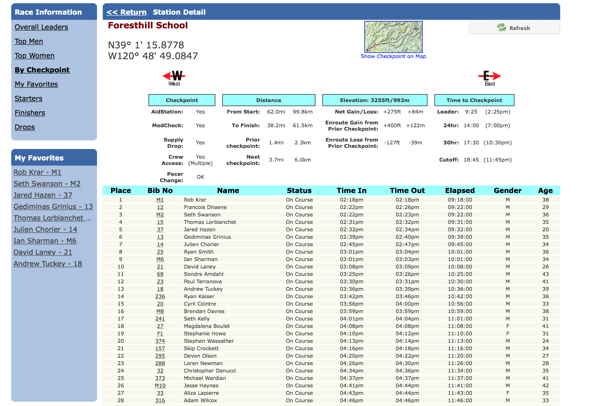
Figure 5. Race splits for Western States collected from UltraLive.net. Again, only the top finishers are shown, but all finisher splits are available from the past year’s webcast.
If your event’s splits aren’t publicly posted (Silver State’s, for example, aren’t), or you must fill in the gaps the websites above may have missed, search for previous race performances on a platform that tracks athletic activities like Strava (Figure 6) or Garmin Connect (Figure 7). Search by race location and keyword.
Sift through these search results to determine which avatars completed the race near your predetermined projected finish time from Step 2. Select an activity to reveal an athlete’s route, profile, and pace (Figure 8). Be sure to expand your search by using all possible keywords and phrases. For example, in addition to “Silver State 50 Mile” look for:
- SS50M
- Silver State
- Silver State 50
- Silver State 50M
- Silver State 50 Miler
Strava also includes the ‘Flyby‘ function (Figure 9), which allows you to view and compare other runners who traveled the same route during the same time frame.
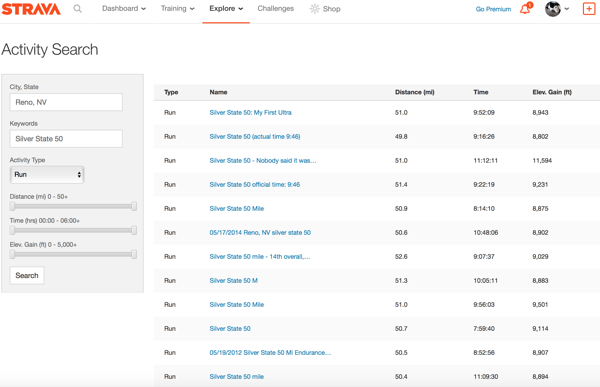
Figure 6. Results from a Strava “Silver State 50” activity search for Reno, Nevada.
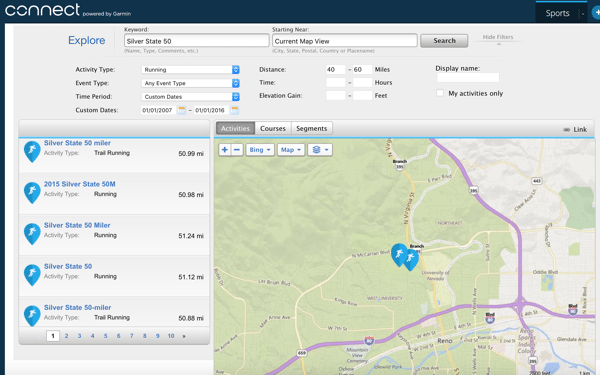
Figure 7. Results from a Garmin Connect “Silver State 50” keyword search starting near Reno, Nevada.

Figure 8. Ian Torrence’s 2015 Silver State 50 Mile Strava data.
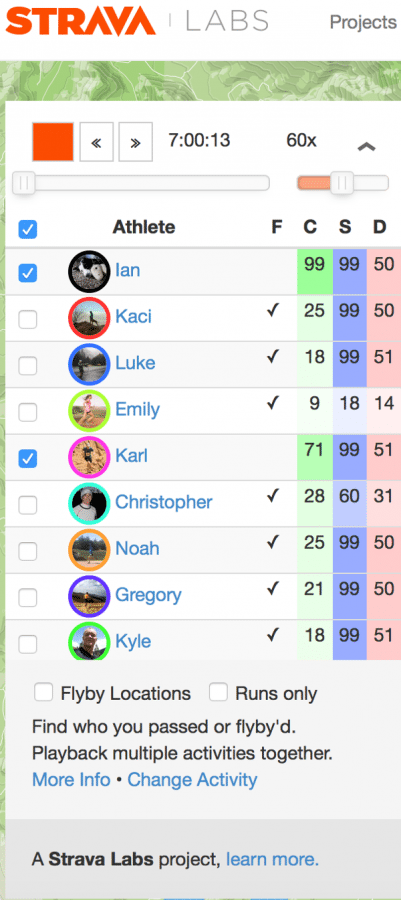
Figure 9. Strava 2015 Silver State 50 Mile Flyby data.
By using the race profile, aid-station locations (Figures 1 and 2), and your avatar’s data (Figure 8), you can now determine how long it took the avatar to travel between checkpoints. For example, at Silver State, the avatar in Figure 10 arrived at Peavine Summit Aid Station in 2:02 and then reached the following aid station, Long Valley, in 3:03 (Figure 11), a 61-minute split. Use this procedure to determine the splits between all aid stations for all your avatars.
Note: As in the data presented here, you may find mileage discrepancies between avatar GPS data and website information. Ultramarathons are rarely measured accurately and GPS units are known for being finicky. The time it took between locations is the necessary data and constitutes a good pacing plan, not the distance covered.

Figure 10. Peavine Summit split (Silver State’s third aid station at mile 12.5).
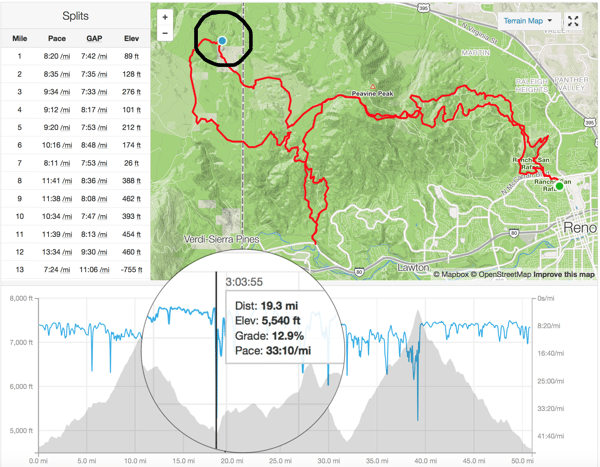
Figure 11. Long Valley split (fourth aid station at mile 19).
Step 4: Determine your race-day pacing using your avatars’ raw data.
Place these splits side by side. You’ll discover that no one, even though they finished at roughly the same time, has the same pacing pattern throughout the race. Note the similarities and differences and at what point the pacing starts to differ. Who had the strongest finish? Did any runners lose big chunks of time at aid stations? Did sections of the course take any of the avatars an uncharacteristically long time to cover? By interpreting the nuances of the data, you can devise your own personalized approach and begin practicing it in training.
However, there are some caveats with this strategy. It may be tough to build a pacing plan if:
- You’ve never run an ultra before.
- The race is a first-year event or there is little to no data available.
- The course is altered significantly from past years.
- Abnormal weather makes racing conditions difficult.
Pacing charts are nothing new. Some events provide rudimentary examples, but now you have a methodology for generating your own detailed projections by using a multitude of recently developed online tools.
Call for Comments (from Meghan)
- How do you develop your race-day pacing strategy?
- Do you use any of these technologies? Do you combine technologies like Ian has to get the biggest bang for your buck?
- Are there additional tools or methodologies that you use to help you formulate your race-day plans?
