[Editor’s Note: This is the first in a two-part series about pacing at UTMB. While this article looks at historical data, the follow-up examines how top runners paced at this year’s event.]
This week, thousands of runners are in Chamonix, France, for one of the most anticipated events of the year: the 2025 UTMB. For the participants, this is the culmination of months or years of hard work and preparation. Hundreds of miles run, hurdles overcome, and bricks stacked, one by one, until each runner is in a position to start this race.
Every runner arrives at the start line with a unique level of fitness, set of strengths, and capabilities to help them complete the race. These factors play into something they will all need to decide on: their race strategy. Do they go out fast and try to hold on until the end? Do they hike the uphills and bomb the downhills? Do they push the ups and save their legs on the downs? Do they begin with a moderate pace that they think they can maintain for most of the race?
UTMB is a notoriously challenging course, with this year’s statistics at about 108 miles and with over 32,000 feet of elevation gain. The steep climbs and punishing downhills have challenged runners over the years who are looking to optimize their performance. Jim Walmsley has taught us that the line between a DNF and a course record can be razor-thin, with small tweaks in how to approach the course resulting in significantly different outcomes.

On his fifth attempt in 2023, Jim Walmsley put together all the pieces of UTMB for a win and new course record. Photo: iRunFar/Meghan Hicks
In this article, we look closely at some of the data behind UTMB performances over the years. Collaborating with Zsolt Kovacs of Spectro.Life, we explore some of the insights he has developed from years of analyzing UTMB performance data. Spectro works with athletes to develop optimal race strategies based on custom running models. I used their product to efficiently pace my first 100-mile race earlier this year.
We look at general trends seen by all finishers at UTMB and dive into the performances of some elite athletes to get a better understanding of what the numbers tell us about the optimal way to race UTMB.
[Author’s Note: This analysis is based on data from UTMB’s live tracker, LiveTrail. Many factors go into performance that cannot be captured in these numbers.]
Intensity Factor and Performance Drop in Recent UTMB, CCC, and OCC Data
Let’s start by looking at we call intensity factor and how it relates to performance drop over races of various lengths at the UTMB Mont-Blanc festival. This should give us perspective on what performance data should generally look like at these races.
Intensity factor is defined as the percentage of the maximum one-hour effort the runner is able to deliver. The one-hour maximum effort is defined as critical intensity, which is similar to FTP in cycling. This metric is normally calculated based on a personalized metabolic running model that equates running speeds on hills to running speeds on flat ground. Not having access to each runner’s personal model, Spectro uses a benchmark running model that we’ve found has a variation of 2.5% at the most.
Performance drop is how much the intensity factor changes from the start of the race to the end of the race, either the finish line or the checkpoint at which a runner drops out.
Looking at the below graph, we can see a clear division between the DNFs and the finishers, in terms of both their intensity factors and performance drops:
Intensity Factors and Performance Drops of All 2024 UTMB Finishers and DNFs
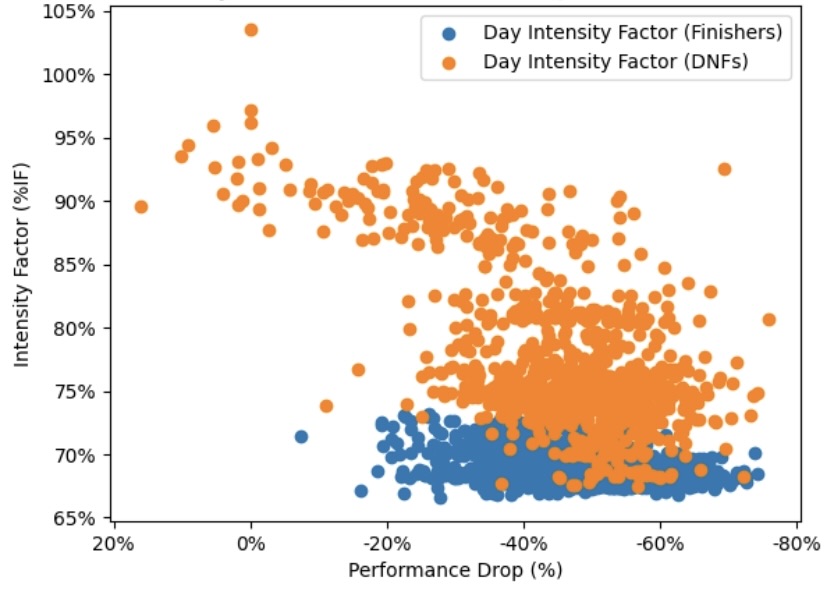
The intensity factors and performance drops of all 2024 UTMB finishers, as well as those who dropped from the race.
The DNFs with the highest intensity factors and the lowest performance drops, those in the top left corner of the graph, most likely encountered some challenge that ended their race very early, before their pace slowed. Other DNFs with high intensity factors and high performance drop likely ran at too high an intensity, which eventually caused their performance to drop so much that they could no longer continue.
Finishers all had average intensity factors below 75%, which shows the range of pacing appropriate for a course of UTMB’s nature.
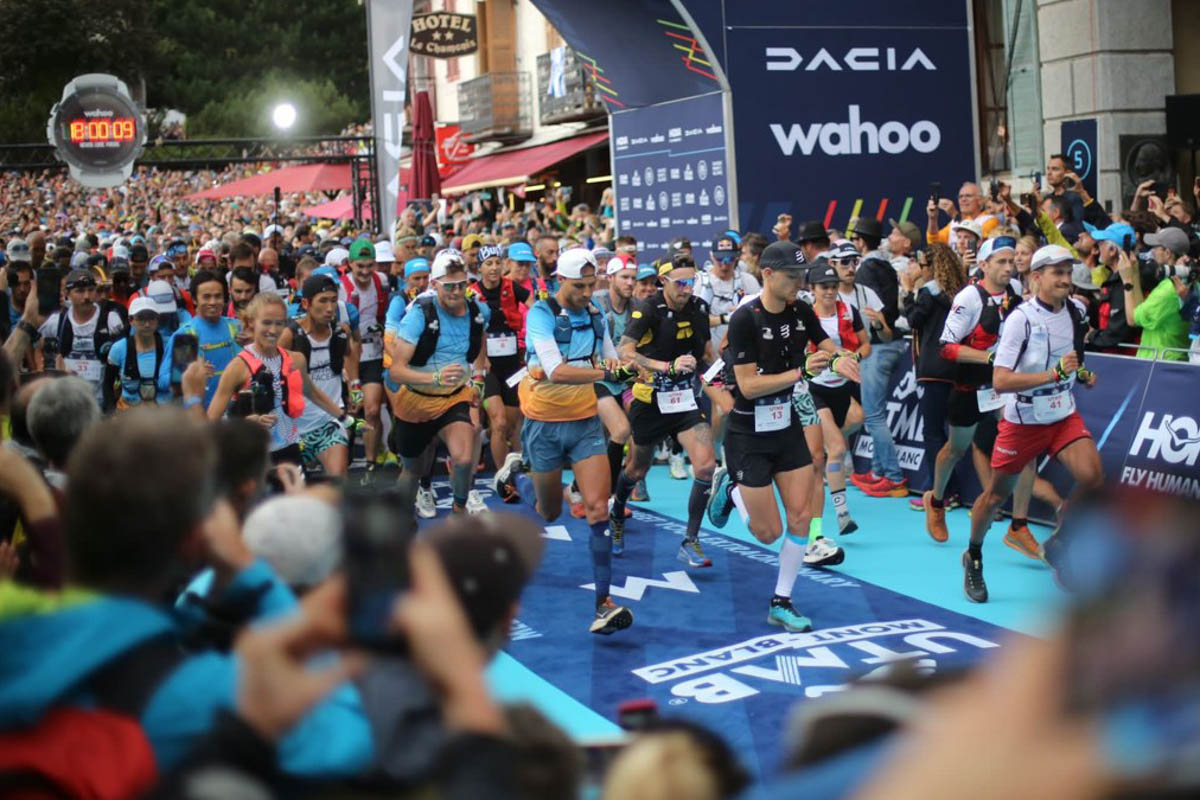
The start of the 2022 UTMB. Photo: iRunFar/Kirsten Kortebein
Performance drop varies with distance and the difficulty of the terrain. Intuitively, this makes sense, as we’d expect someone running the 50-kilometer OCC to be able to maintain a higher level of effort through the end of the race than someone running the 108-mile UTMB. The graphs below show performance drop distributions for the 2024 UTMB, the 100k CCC in 2023, and the 2023 OCC. You can see that the mean performance drop for UTMB is -47.68%, CCC is -35.86%, and OCC is -26.19%.
2024 UTMB Finishers Performance Drop Distributions
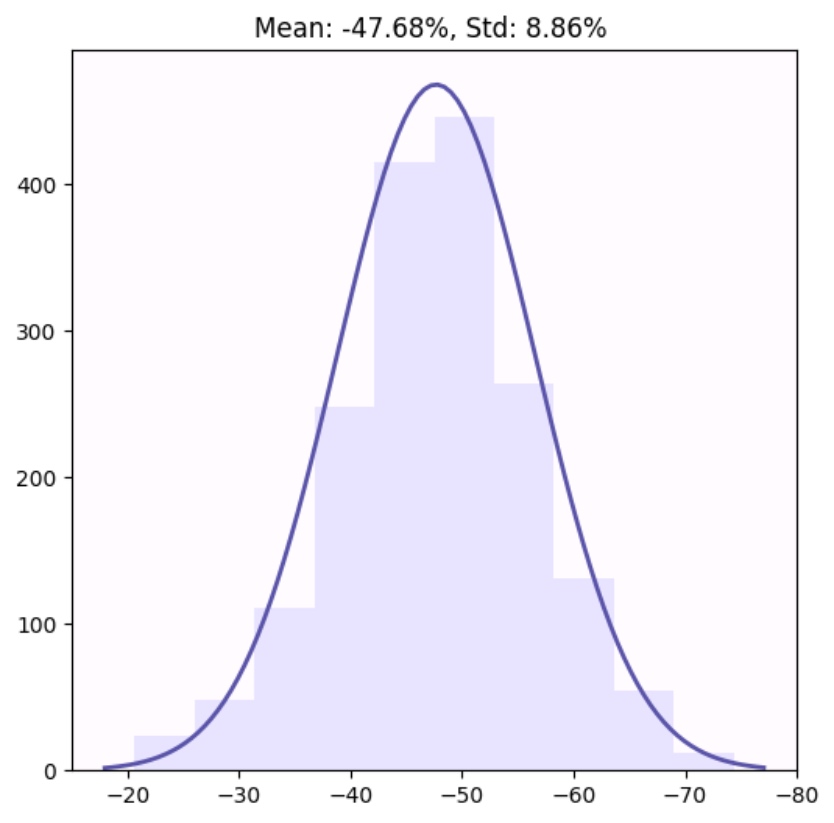
A graph showing the performance drop distributions for the 2024 UTMB.
2023 CCC Finishers Performance Drop Distributions
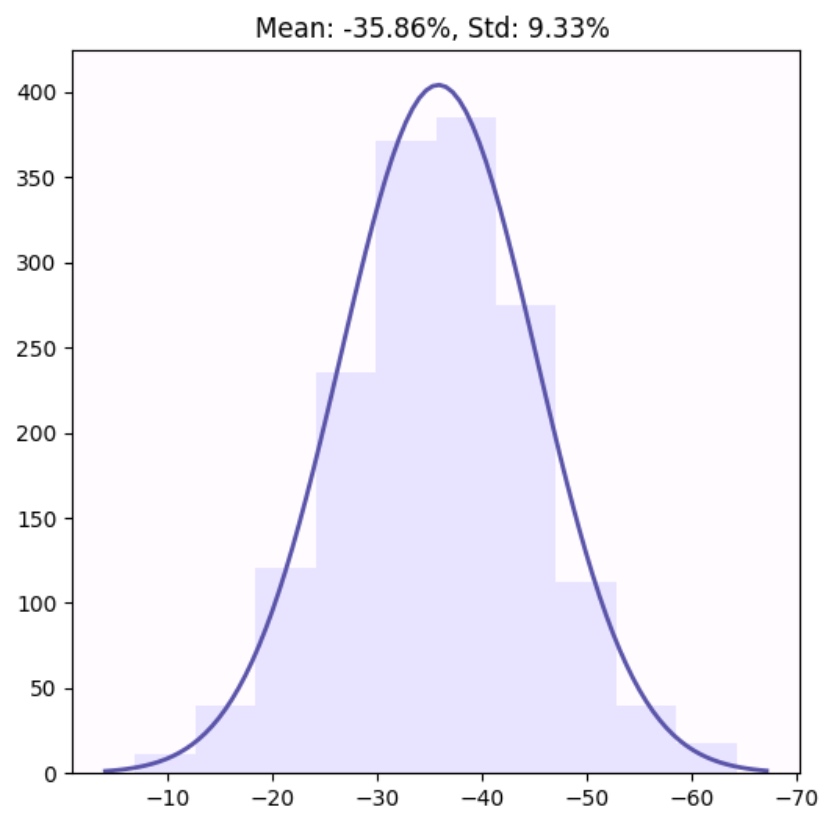
A graph showing the performance drop distributions for the 2023 CCC.
2023 OCC Finishers Performance Drop Distributions
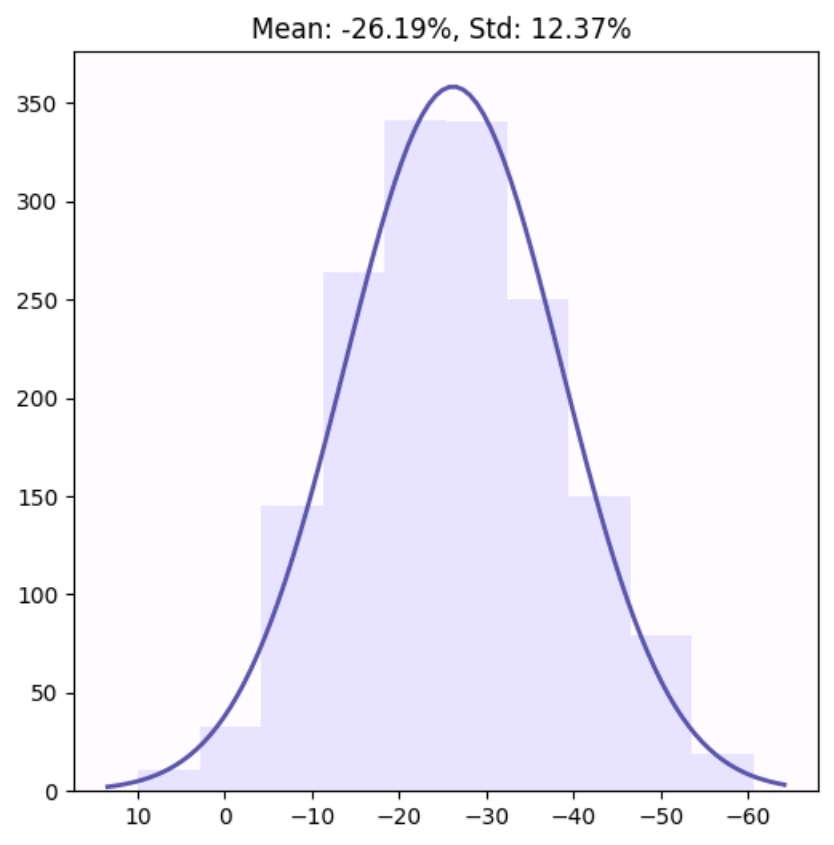
A graph showing the performance drop distributions for the 2023 OCC.
2024 UTMB Men’s Podium Finisher Performances
Now, in the graph below, we zoom in on the top 10 men finishers of the 2024 UTMB. We plot the intensity factor on the y-axis and the distance on the x-axis, with each runner’s performance drop listed in the legend. We can see that some runners paced their races with relatively even intensity factors, while others had significant swings. Obviously, all of them performed quite well, and we also see that their performance drop is low relative to the mean of -47.68% seen in the graph above.
Intensity Factors and Performance Drops of the Top 10 Men at the 2024 UTMB
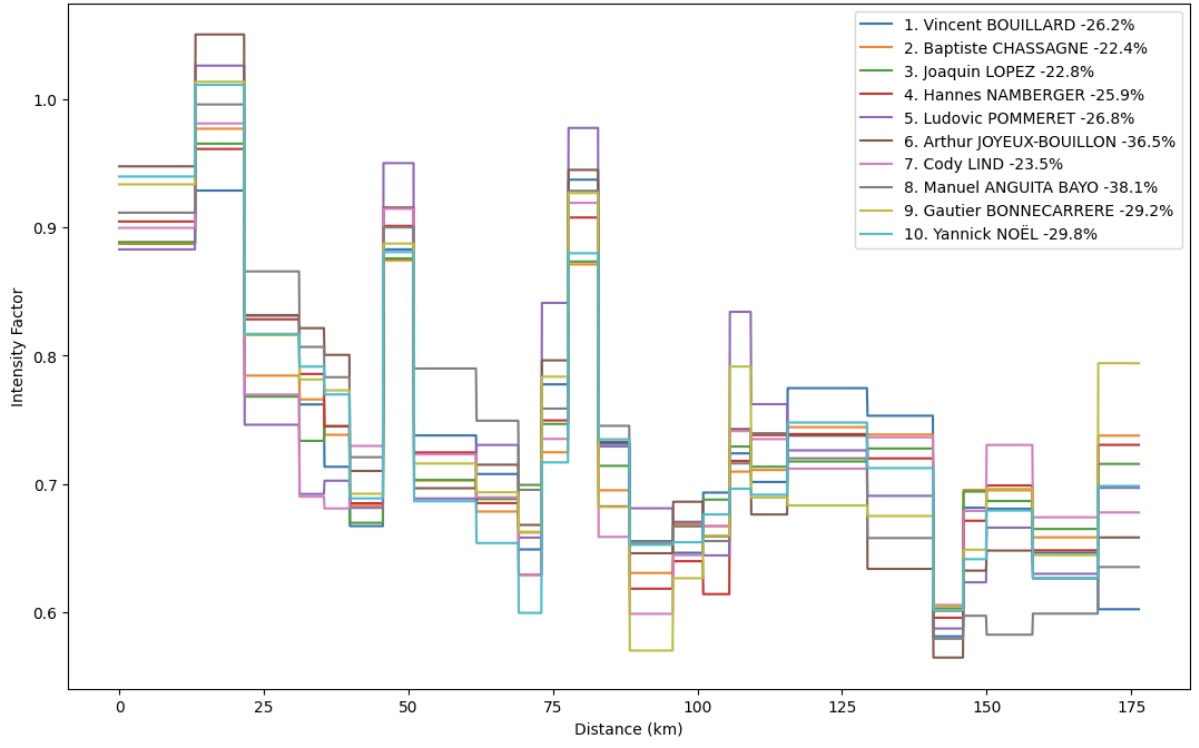
A graph showing the intensity factors (on the y axis) and performance drops (in the legend) for the top 10 men at the 2024 UTMB.
There is a lot going on in the above graph, but bear with me as we break it down here in more detail.
For example, Vincent Bouillard, who won the men’s race, had a performance drop of -26.2%. To see where that number comes from, we look at the graph below, which has the race’s elevation profile, Bouillard’s intensity factor during each section, and shows the change over time. As defined above, the performance drop is the change in intensity factor from the beginning of the race to the end.
Intensity Factor and Performance Drop of the 2024 UTMB Men’s Champion Vincent Bouillard
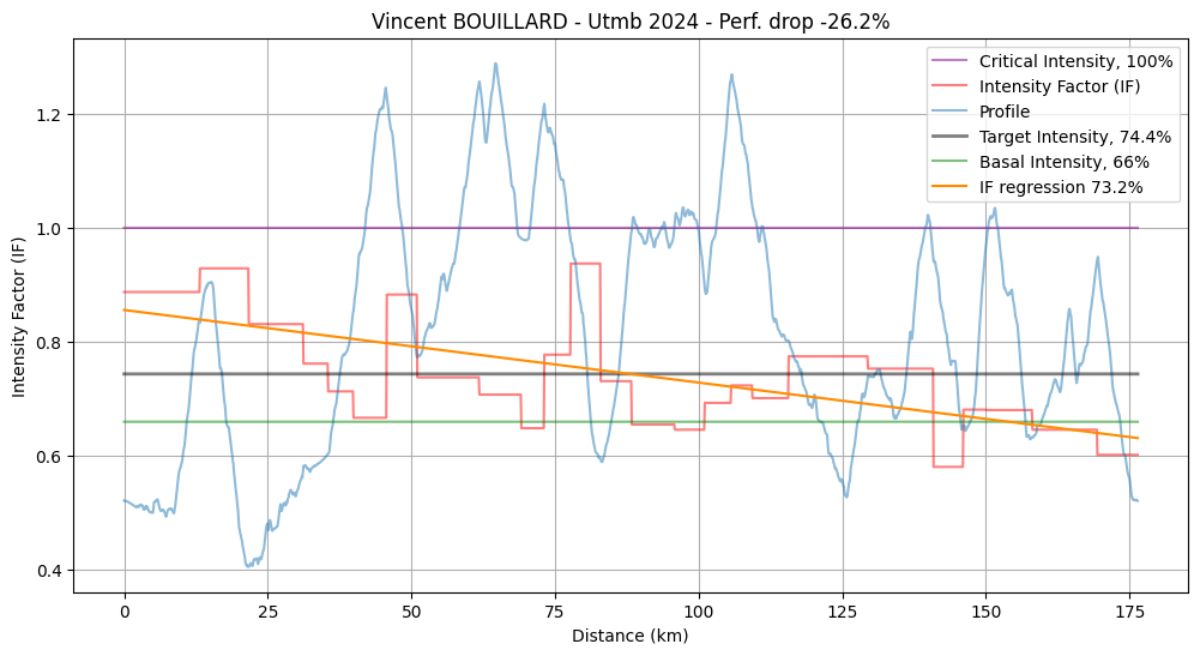
The intensity factor and performance drop of the 2024 UTMB men’s champion Vincent Bouillard.
In the above graph, we can see that Bouillard had some spikes in the intensity factor during the descents, meaning he ran those harder. It is interesting to note where some of these spikes take place for runners and their strategies around attacking the climbs or the descents, as well as earlier or later sections of the course, while making sure their intensity factor does not drop too much.
It is also interesting to note that the top finishers are running with an average intensity factor of below 75%. For a race as long and challenging as UTMB, being able to run efficiently in this zone is critical for success.

Vincent Bouillard on his way to winning the 2024 UTMB. Photo courtesy of UTMB.
Next, we examine the chart from men’s second-place finisher Baptiste Chassagne, who had an even lower performance drop of -22.4%, the lowest of all the top 10 men.
Intensity Factor and Performance Drop of the 2024 UTMB Men’s Second-Place Finisher Baptiste Chassagne
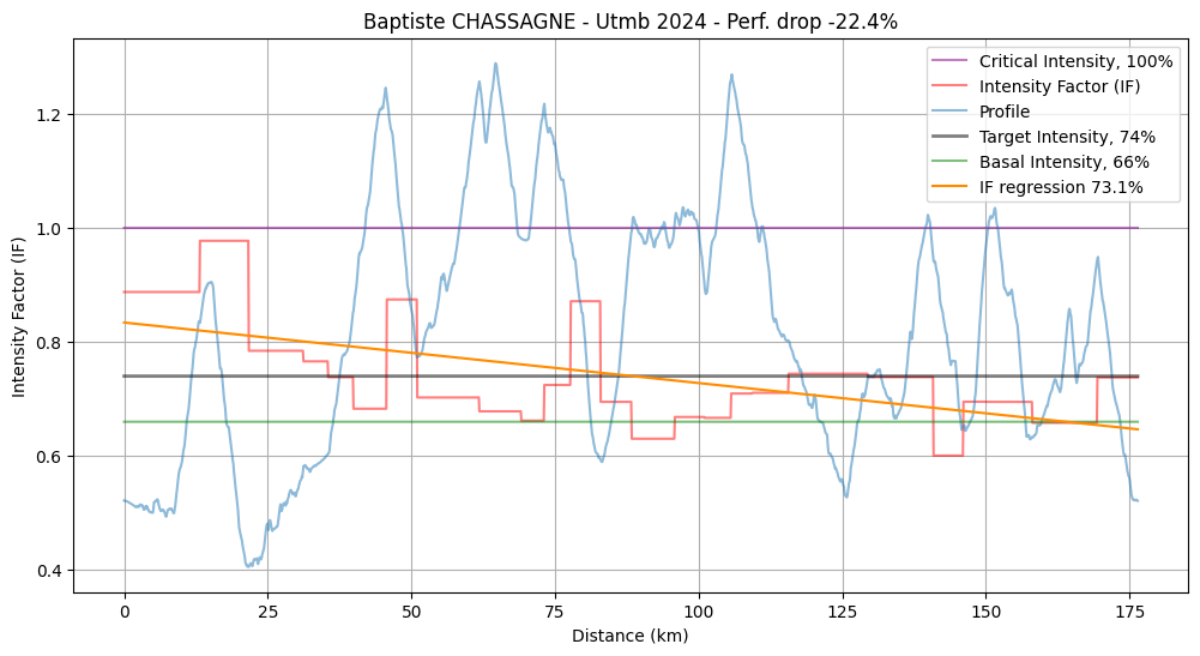
The intensity factor and performance drop of the 2024 UTMB men’s second-place finisher Baptiste Chassagne.

Baptiste Chassagne was pretty stoked to take second at the 2024 UTMB. Photo: iRunFar/Meghan Hicks
Here is one more graph from men’s fifth-place finisher Ludovic Pommeret, where again we can see surges in intensity factor on certain portions of the course. Pommeret followers and fans know he’s a master downhiller, so it’s not a surprise to see his intensity factor to be quite high on the downhills.
Intensity Factor and Performance Drop of the 2024 UTMB Men’s Fifth-Place Finisher Ludovic Pommeret
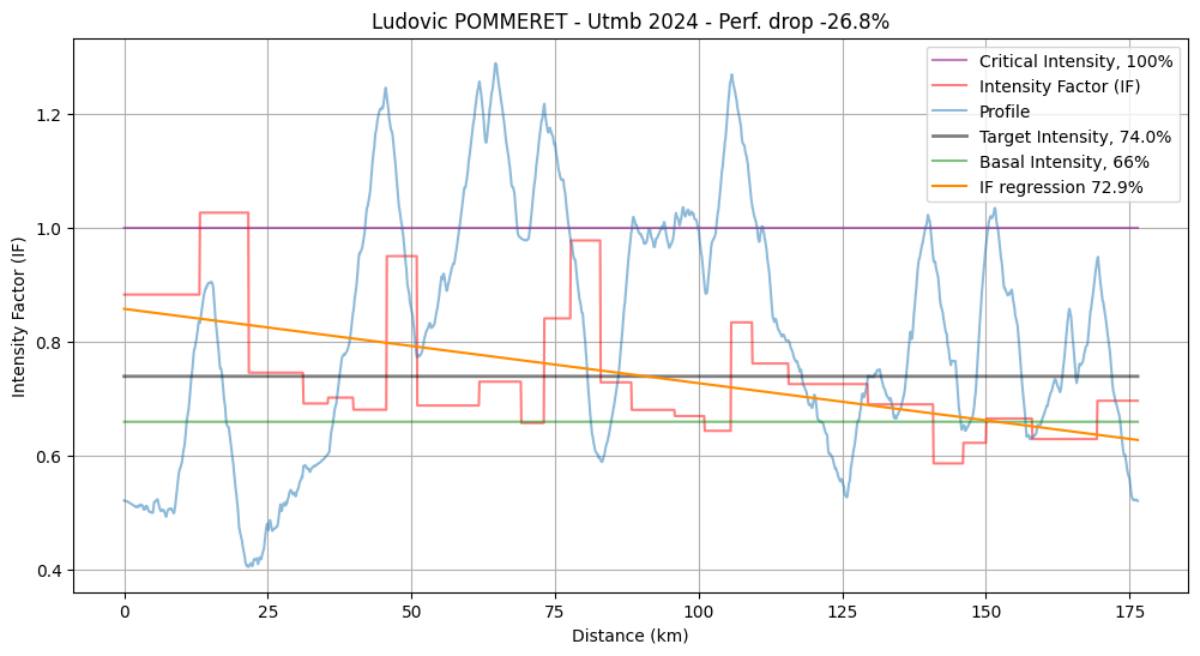
The intensity factor and performance drop of the 2024 UTMB men’s fifth-place finisher Ludovic Pommeret.

Ludovic Pommeret on his way to finishing fifth at the 2024 UTMB. Photo: iRunFar/Eszter Horanyi
2024 UTMB Women’s Podium Finisher Performances
Now, on the women’s side, we compare the intensity factor for the top 10 finishers. What stuck out to me is that the average intensity factor started out higher and resulted in a greater average performance drop throughout the race.
Intensity Factors and Performance Drops of the Top 10 Women at the 2024 UTMB
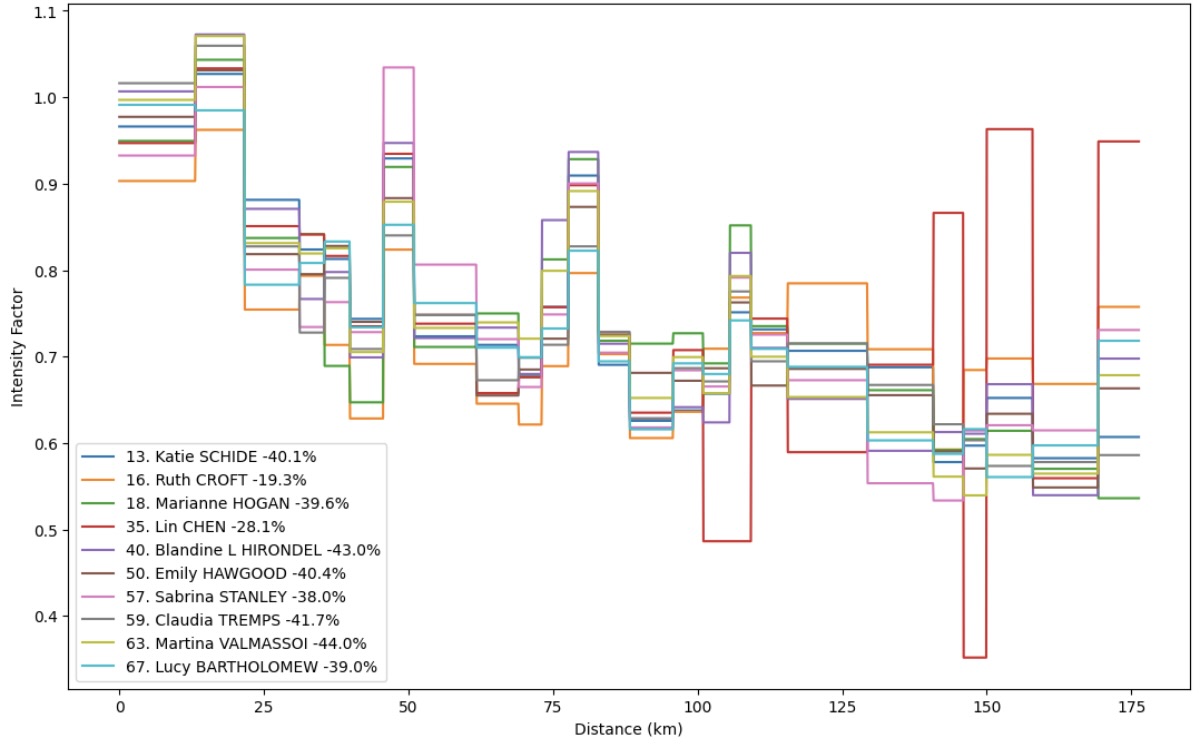
A graph showing the intensity factors (on the y axis) and performance drops (in the legend) for the top 10 women at the 2024 UTMB.
To zoom in on tangible examples of differing performance drops, let’s examine the performances of the top three women finishers at last year’s UTMB.
The eventual women’s winner, Katie Schide, started off the race well below course record pace. She was at a high intensity factor early on, but fell off over the course of the event with a -40.1% performance drop. Though her performance dropped significantly over the course of the race, her very high intensity for long in the first half built an unsurmountable lead over the rest of the field.
Intensity Factor and Performance Drop of the 2024 UTMB Women’s Champion Katie Schide

The intensity factor and performance drop of the 2024 UTMB women’s champion Katie Schide.

Katie Schide after winning the 2024 UTMB. Photo: iRunFar/Meghan Hicks
Second-place finisher, Ruth Croft, on the other hand, started off at a more conservative pace with a lower intensity factor at the beginning of the race. This approach enabled her to limit the performance drop over the course of the race to -19.3% and close in impressive fashion. Croft’s performance drop was the lowest of all the top 10 women and men at last year’s race.
Intensity Factor and Performance Drop of the 2024 UTMB Women’s Second-Place Finisher Ruth Croft
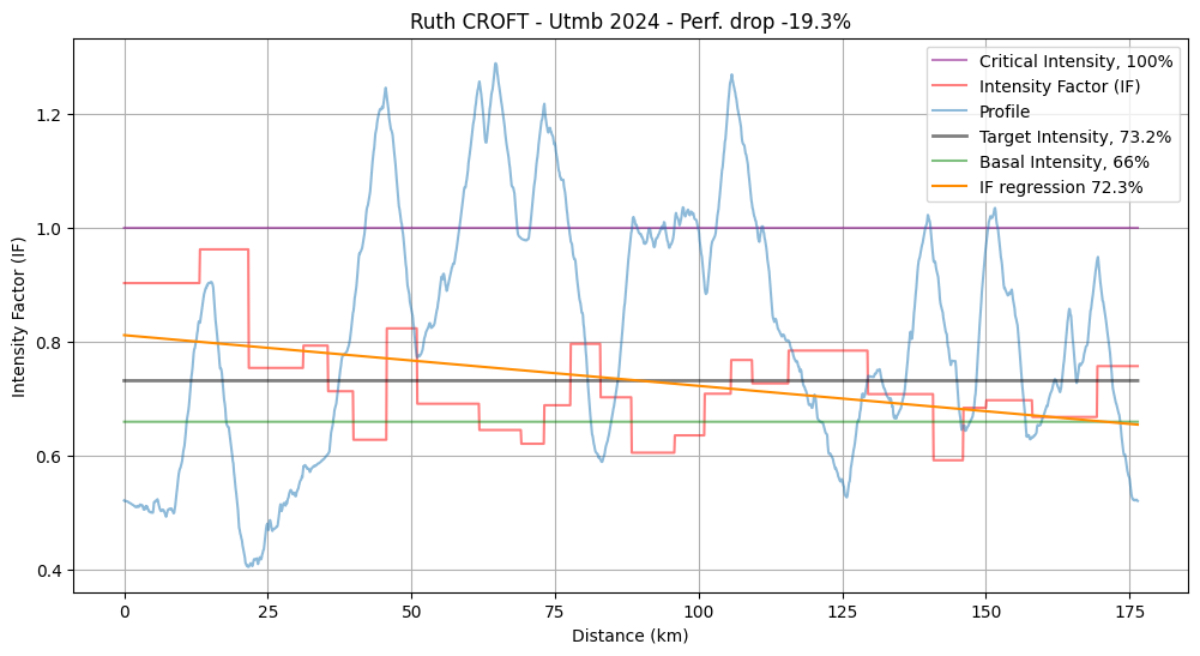
The intensity factor and performance drop of the 2024 UTMB women’s second-place finisher Ruth Croft.

Ruth Croft flying through Champex-Lac during the 2024 UTMB. Photo: iRunFar/Eszter Horanyi
Third-place finisher, Marianne Hogan, also started off at high intensity and pushed hard at certain parts of the course, which led to a -39.5% performance drop. Hogan was passed in the final 15 kilometers by Croft. This tight finish demonstrates the razor edge that defines optimal pacing strategies and the importance of pushing the intensity enough to put yourself in a competitive position while keeping it restrained enough to finish strong.
Intensity Factor and Performance Drop of the 2024 UTMB Women’s Third-Place Finisher Marianne Hogan
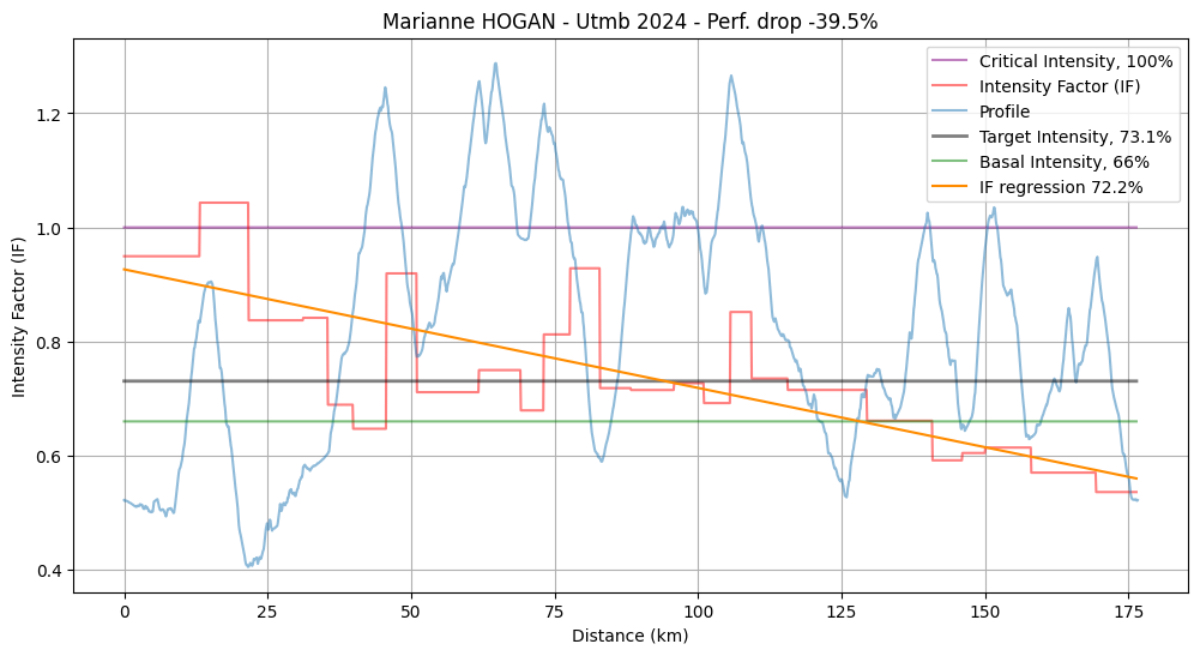
The intensity factor and performance drop of the 2024 UTMB women’s third-place finisher Marianne Hogan.

Marianne Hogan at Champex-Lac, on her way to placing third at the 2024 UTMB. Photo: iRunFar/Eszter Horanyi
It is interesting to see the differences in how athletes choose to run the course and how they maintain their performance throughout the duration of the event. The 100-mile distance is full of challenges, and problem solving is required to deliver an optimal performance. Every year, we see some runners go out fast and try to hold on until the end, while others take a more conservative approach at the beginning and close strong. As races start faster and faster, it is interesting to keep an eye on this, and it will be something to watch at this year’s event.
Closing Thoughts
With this year’s UTMB upon us, we can all observe and enjoy the race strategies that each athlete implements. Good luck to each of you in finding your ideal pacing strategy!
We hope this article gives you insight into how the intensity factor can impact performance over the course of an event. As the data in this article show, keeping pacing strategy in mind from the start of UTMB, or any ultra, can have significant rewards at the tail end of the event if you are able to limit the performance drop.

The sun sets in Chamonix on Friday evening as the 2024 UTMB racers head into the night. Photo: iRunFar/Kirsten Kortebein
Thank you to Spectro.Life for providing the data used in this article and their work around the UTMB event. If you are curious about learning more about this topic or want help developing your perfect pacing strategy, reach out to the Spectro team.
Call for Comments
- Have you experienced a significant performance drop or “hit the wall?”
- How have your views on pacing changed over time?
- Are there any athletes you think do a great job at strategizing their races?
- What racing strategies do you think we’ll see at UTMB this weekend?
