There is plenty to love about the Western States 100 — the beautiful trails, the community, the history, the competition, the storylines. But this month, we’re paying homage to the treasure trove of data the race organization maintains on its website.
If you’d like a refresher on fascinating aspects of this iconic race or if you’re a newer fan of the event, strap in. Do you know of interesting statistics or data points we didn’t include in the article? We’d love to hear from you in the comments section!
Twenty Aid Stations and 1,500 Volunteers
As a world-class production with excellent attention to detail and exciting live coverage, those of us following the race from afar can be prone to forgetting that race organizers are participating in their own impressive endurance event. They make it look easy.
In reality, the Western States 100 is a large and logistically complex event. Its 20 aid stations span two sides of the American River. The trail includes large, remote sections with no cell coverage. The safety and performance goals of athletes depend on an estimated 1,500 volunteers whose roles include — but aren’t limited to — keeping aid stations stocked, helping athletes cool down with water and sponges, tending to medical issues, and tracking athletes. The event website states that volunteers “spend days preparing for the run and will be at their stations for over 30 hours.”

Spectators and volunteers stay cool in the river at the Rucky Chucky river crossing, a critical point in the race for runners at mile 78. Photo: iRunFar/Alex Potter
Ninety Tevis Cup and Western States 100 Finishers
Western States honors individuals who have completed both the Western States 100 running race and the Western States Trail Ride endurance ride for horses and humans, also known as the Tevis Cup, on a page of its website. Part of the event’s lore is that Gordy Ainsleigh completed the first Western States in 1974 when he ran the course alongside the human and equine participants of the Tevis Cup.
As of June 2025, 90 individuals have completed both events. Susan Kramer is the most recent female finisher of the Tevis Cup on the list, as she completed both the running race and the endurance ride in 2021. Pat Fitzgerald finished Western States three times from 1983 to 1985, and has Tevis Cup finishes spanning from 1958 to 1986.
First Finishers in 1974 and 1978
Gordy Ainsleigh became the event’s first finisher in 1974, as stated above. Pat Smythe became the race’s first female finisher in 1978. She was the co-founder of a Bay Area running organization called “Women on the Run,” and strived to raise awareness of women’s potential to succeed at long distance racing. That same year, Shannon Weil became co-race director with Mo Livermore, highlighting women’s long history of excellence at Western States on the organizational side as well.
A 12% Chance of a Snow Route and a 26% Chance of a Boat Crossing
The race website’s meticulous stats include information on snowpack for each year, dating back to 1983, for the Sierra Nevada, the mountain range through which the race travels. Race organizers have implemented a snow route five times in those 43 years, when snowpack made the first aid stations inaccessible. The last time a snow route was used was in 2011.
According to the race website, the snow water content on April 1, 2025, was 41.2, compared to 65.0 in 2011. The snow route appears to be most likely in years when the snow water content is higher on June 10. Snow water content averaged 68.36 inches on snow route years. In contrast, snow water content was 5.3 inches, on average, in years when the standard course was used.
Snowpack in the high mountains, in combination with when water is released from water control structures upriver, help to decide how runners cross the American River at 78 miles into the race, at what’s affectionately called the Rucky Chucky river crossing. In 11 of those 43 years, racers have crossed via boats. In other years, racers wade across the river while holding onto a rope.

The Rucky Chucky river crossing during the 2023 Western States 100, a year when boats were used to cross the river. Photo: iRunFar/Meghan Hicks
Average of 44 Runners Get in from the Wait List
Since a wait list was first implemented for the 2017 edition, an average of 44 runners from the wait list ultimately gain entry to the event before race day (1). If we exclude the 2020 edition of the race, which was canceled, at least 31 wait-listed runners per year ultimately gain entry into Western States in the year they are placed on the wait list. That figure has been as high as 68, which is how many wait-listed runners entered Western States in 2022.
Favorable Temperatures Mean Favorable Finishing Rates
Aside from the 100% finisher rates in 1974 and 1976, when the single starter for each edition completed the event, Western States has seen its highest finisher rates in 2023 and 2019, with 86.5% and 86.4% of entrants finishing, respectively. Notably, the daytime high for those years was a more modest temperature than is sometimes experienced at Western States, with 2019 being the warmer of the two years with a daytime high of 83 degrees Fahrenheit, compared to an average high of 89.
In contrast, the 2006 edition was one of the hotter years, with a daytime high of 101 Fahrenheit. At 52.6%, the finisher rate that year was the lowest seen since 1986. The correlation between temperature and finisher rate isn’t clearcut, though. For example, the event has seen some of its highest finisher rates since implementing a waitlist in 2017; it is possible runners who determine they are unlikely to finish prior to the event are inclined to DNS so their spot on the starting line can go to another runner.

Jim Walmsley celebrates after setting the Western States 100 course record in 2019. Favorable conditions meant that year’s race also saw a high proportion of finishers. Photo: iRunFar/Bryon Powell
The chart below, updated from a previous article on temperature and course conditions at Western States, shows there hasn’t always been an obvious relationship between daytime high temperatures and finisher rates, since 1985.

Scatterplot showing the co-relation between heat and finisher rates at the Western States 100, since the 1985 edition of the race.
Composition of the Start Line
Let’s turn our attention now to the composition of the field to better understand who gets an entry into this event and how they have performed over the years. Last year, we did a deep dive into the lottery process for Western States, and discussed the three main ways to get into the event.
- Become very involved with the event, such as by being a board member or by volunteering at an aid station for many years;
- Be really, really fast; or
- Gain entry through the race lottery.

Pie chart showing the breakdown of Western States entrants and how they secured entry.
Performance Distribution
Let’s start by taking a look at the distribution time of Western States finishers. By plotting all finish times from 2000 onward in 30-minute increments, we get the following graph.

Bar chart showing the number of Western States finishers in different finish-time brackets between 2000 and 2024.
A few things from this plot that jump out are the silver buckle blimp and the “Golden Hour” spike. All finishers who run sub-24 hours receive a coveted silver buckle. Those who finish from 24 hours to 30 hours get a bronze buckle. It is quite interesting to see how this goal of running under 24 hours skews the finish times so dramatically, creating a significant spike in the hour before.
Similarly, we can observe a large group finishing in the Golden Hour, the hour before the end of the race. This hour, on average, has the largest number of finishers, who are fighting to the very end to make it across the finish.

Kuni Yamagata, at 68 years old was the oldest male finisher of the 2021 Western States 100, and finished during the Golden Hour. Photo: iRunFar/Alex Potter
Top Performances
On its website, Western States displays data on the top 100 finishes in the history of the race. By plotting this data we get an interesting view into how the race has evolved over time and mirrors some of the findings we dove into on the progression of trail races.
On the men’s side, we see a few scattered standout performances in the early years, with the past 15 years bringing more top 100 performances. In 1988, Brian Purcell ran a blistering time of 16:24, taking the win. From 1999 to 2005, Scott Jurek reset the standard with dominant performances in consecutive years. The year 2010 is the first year we see multiple finishers on the top 100 all-time list, with subsequent years having an increasingly larger number of individuals below the current cut of 16:28:34.
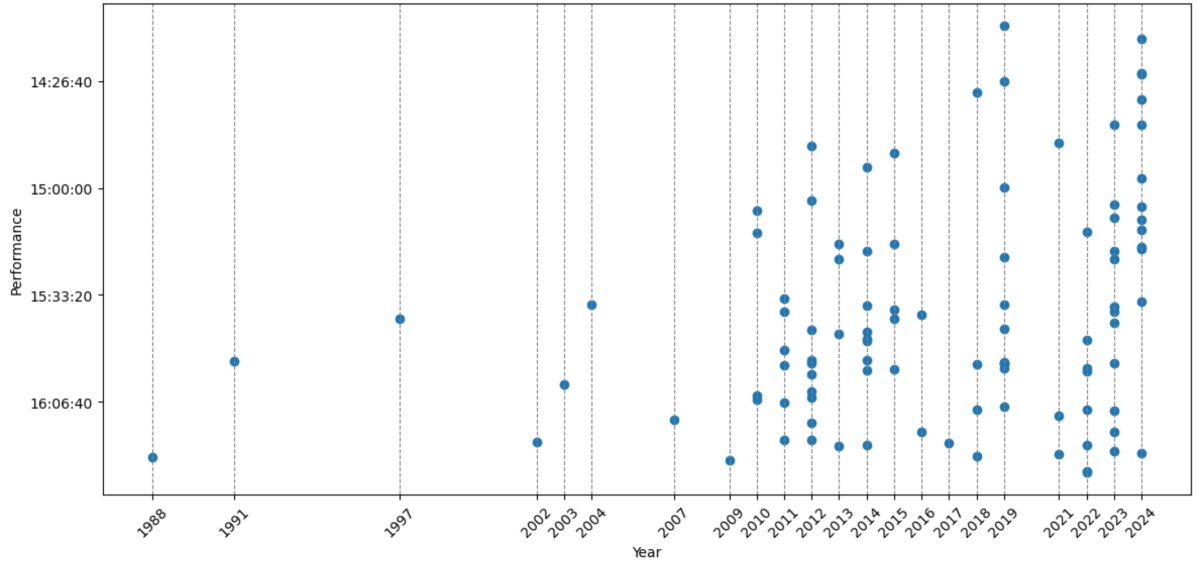
Scatterplot showing standout men’s performances at Western States through the years.
On the women’s side we see the incredible performances of Ann Trason from 1989 to 2003 in a league of her own. From 2011 to 2018, we see a slow increase of top 100 finishes, with the last five years really bringing a jump in the top of the field.

Scatterplot showing standout women’s performances at Western States through the years.
Masters and Beyond Categories
Western States has a masters category that recognizes the performances of runners aged 40 and older. This category is also seeing a boost in top-end performance time. In 2024, the records on the men’s and women’s sides were broken with Tyler Green and Ida Nilsson both shaving off around 40 minutes from the previous records.
The event also keeps track of age-group performances through the 70-and-up age group for men and women. Jeff Browning, age 53, for example, has stated his intention this year of chasing the men’s 50-to-59 age group record, set by Steven Moore at 18:14:57 in 2019.

Ida Nilsson on the way to setting a new masters record at the 2024 Western States 100. Photo: iRunFar/Bryon Powell
Oldest Finishers
Western States also awards prizes for the oldest male and female finishers. These finishers prove that age is just a number. The oldest finishers are Nick Bassett on the men’s side, in 2018 when he was 73, and Gunhild Swanson, who finished at the age of 70 in 2015. Bassett, now aged 80, is signed up to run the 2025 edition. There is always a goal to keep running toward!

The crowd celebrates after Gunhild Swanson finished the 2015 Western States 100 with six seconds to spare. Photo: Ted Knudsen
Call for Comments
We could probably write another 10 pages with all the data around Western States, but we will leave it at that. If you want to keep exploring the history and numbers of the race, I would recommend this year-by-year walkthrough. And, let us know of other fun Western States statistics or history in the comments!
Notes/References
- This figure includes the wait-listed runners who have gained entry to the 2025 edition at the time of writing. The average will change if additional runners gain entry to the 2025 edition prior to race day.

