[Editor’s Note: Welcome to a limited-series column by runner and data analyst Mallory Richard where we dive into data from the sports of trail running and ultrarunning to look for trends, see our sports’ progression through time, and have fun playing with numbers.]
We often talk about how the Western States 100 is getting progressively more competitive. The men’s course record has fallen multiple times in the last decade, and iRunFar described the 2021 women’s race by saying:
“With three women inside the top-10 overall, some of the fastest times ever run on the course despite high heat, and tight competition wire to wire, the top-10 women changed Western States 100 history — and women’s ultrarunning history — this weekend.”
But it’s a lot of fun to talk about just how much the competitive depth of the men’s and women’s fields has increased over the years. For decades, the winning times at Western States have been fast results most of us can only dream about in our richest fantasies, and yet even those are getting faster.
In the rest of this article, we’ll use data to quantify the growing competitive depth of Western States, and see if that trend is percolating through the rest of American trail ultrarunning.
The 2019 Western States 100 fans. Photo: Michael Lebowitz
How the Fastest Runners of the Western States 100 Are Getting Faster
Okay, so we know that the Western States winners are getting faster, by the facts that course records have been touched multiple times over the last decade and the top runners each year are finishing in the near-fastest times ever. What’s equally striking is that the chase packs are getting faster, too, particularly on the women’s side.
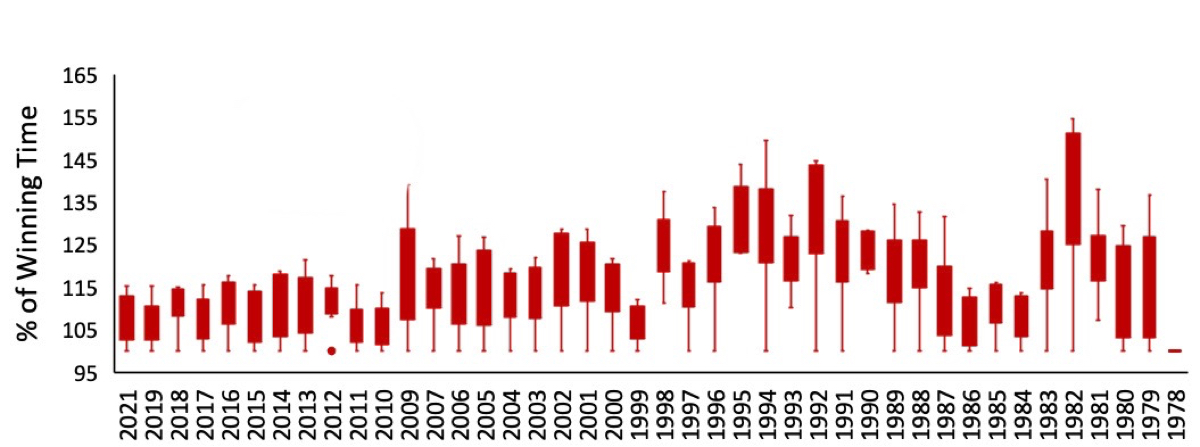
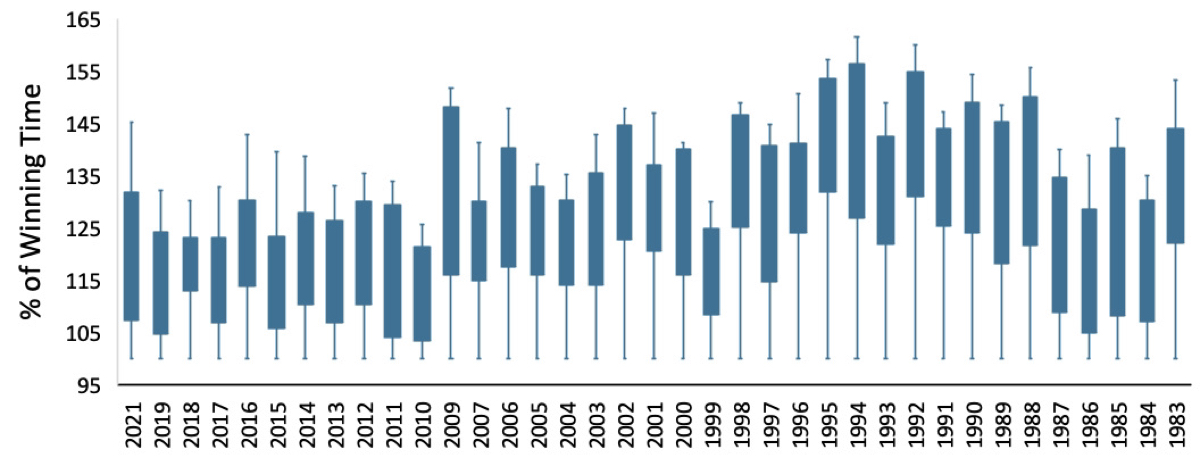
To quantify this change, I calculated every Western States finisher’s time as a proportion of the winning time for their respective year. For example, when I finished Western States in 22:44 in 2017, my time was 116% of Cat Bradley’s winning time of 19:31. The box plots below indicate the spread or range of times among top-10 finishers each year.
Distribution of Women’s Top-10 Finishing Times
Distribution of Men’s Top-10 Finishing Times
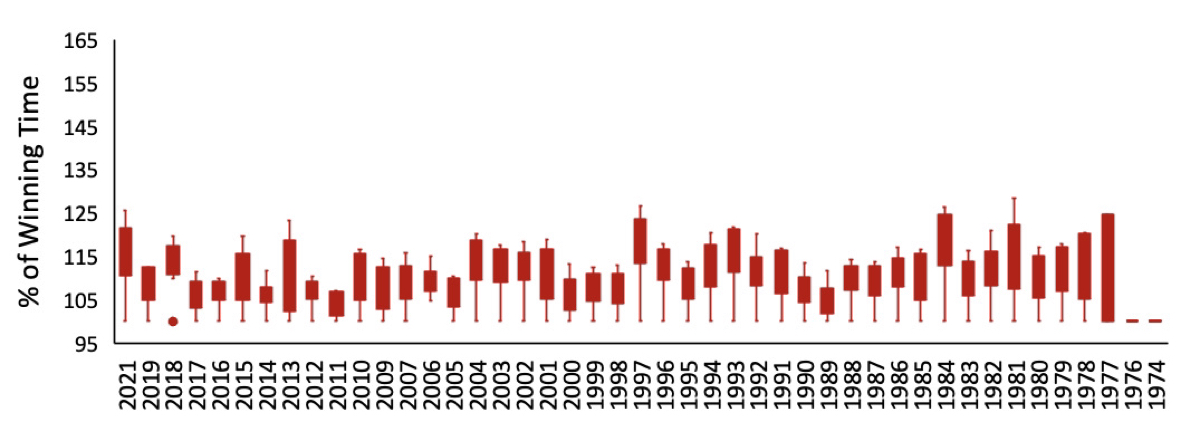
If you’re new to reading box plots, here’s a quick summary of what you’re looking at. For each year, the lowest point is the winning time. Ellie Greenwood’s 2012 win and Jim Walmsley’s 2018 win appear as circles that are unattached to the box-and-whisker shape that represents the other top finishing times. That means their finishes were so fast that they were statistical outliers!
In all other situations, the winning times are at the end of the “whisker” of each box. In years where you see a long whisker, that means the fastest times were relatively far from the median (middle) time of the top-10 finishers.
Ellie Greenwood on her way to a Western States 100 course record in 2012. Photo: iRunFar/Meghan Hicks
The “box” portion of the box plot represents the bulk of data points in the middle. For a list of top-10 finishers, you can think of the “box” as containing the runners in third through eighth place with runners in first, second, ninth, and 10th on the “whiskers.” What’s most significant here is the size of the box shape: long boxes mean that for a given year, the top-10 finishers were generally spread out.
Short boxes mean that these runners finished closer together, making it a more competitive race because there is more potential for top racers to overtake each other as soon as one pauses too long in an aid station or hikes too much of a section. If the entire box-and-whiskers spread on a particular year is long, it represents a wide spread — possibly several hours — between the winner and 10th place. A smaller spread suggests the top-10 runners were hot on each others’ heels.
Jim Walmsley, 2019 Western States 100 champion. In this race, he set a course record for a second year in a row. Photo: iRunFar/Bryon Powell
This trend holds true on the women’s side if we zoom out to include the top-20 finishers per gender. The graphs below present what many recent Western States Golden Ticket winners and returning top-10 finishers know from personal experience: A competitive ultrarunner can have the race of their career, and still finish outside of the top 10. The margin for error for these elite runners is shrinking every year as the number of fast runners waiting to overtake them during a rough patch grows.
Distribution of Women’s Top-20 Finishing Times
Distribution of Men’s Top-20 Finishing Times
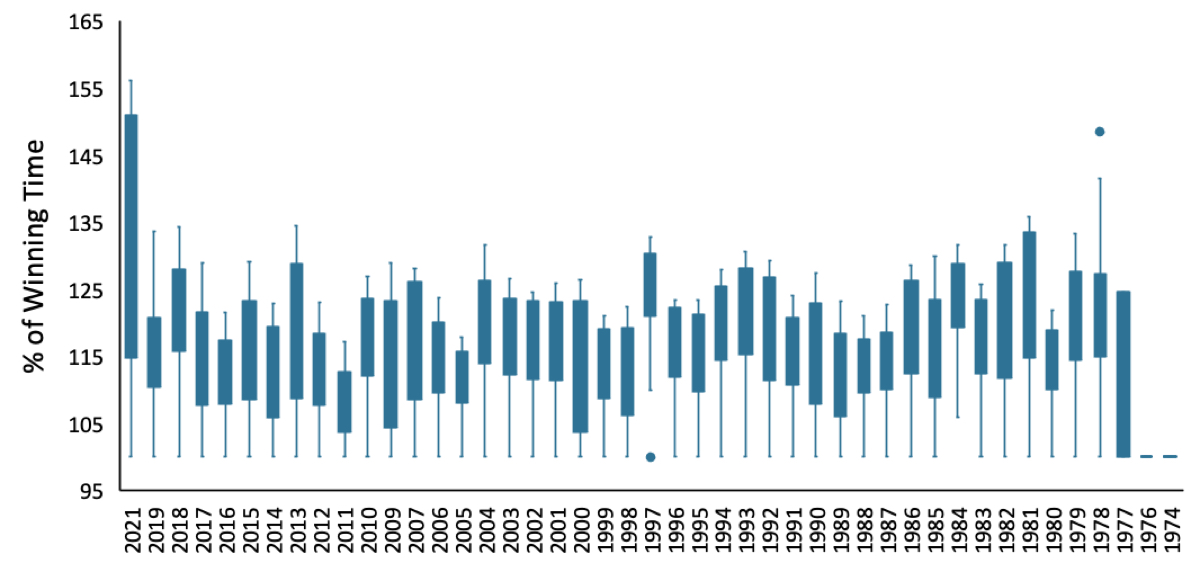
This is also true on the men’s side, but slightly less so. The long whiskers on these charts represent the top male racers who are finishing well ahead of their chase packs. For the men winning the race and finishing on the podium, the chase pack is relatively farther back. Of course, if you’re a devoted fan of Western States, you didn’t need me to create a chart to tell you this.
You’re probably well aware that last year Jim Walmsley bested second-place Tyler Green by over an hour and 10th-place Alex Nichols finished in 125% of Walmsley’s winning time. The race is so competitive that even a runner like Jim Walmsley cannot afford a major miscalculation in his racing strategy, but the frontrunners haven’t had to race each other on the track the way that Stephen Kersh, Patrick Reagan, Jeff Browning, and Kyle Pietari did in 2019.
Is Everyone in American Trail Ultrarunning Getting Faster?
What about the Western States field in general? Are we amateur runners getting faster, too? It’s less clear, as the results can vary a lot from one year to the next.
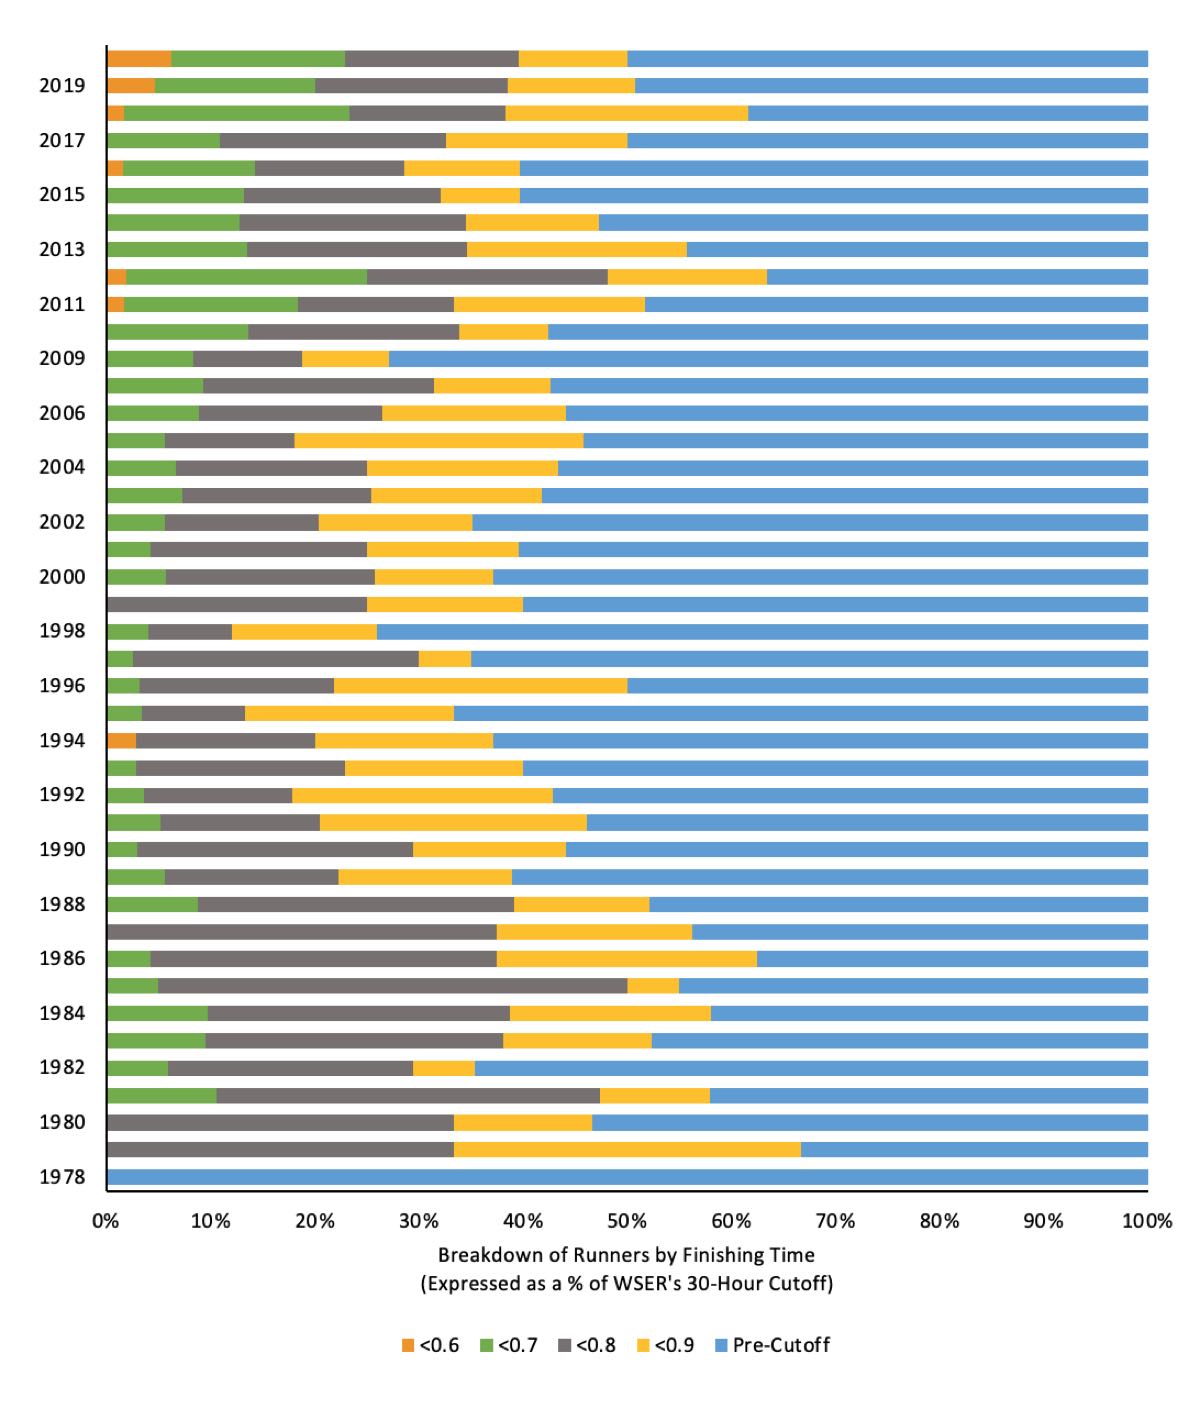
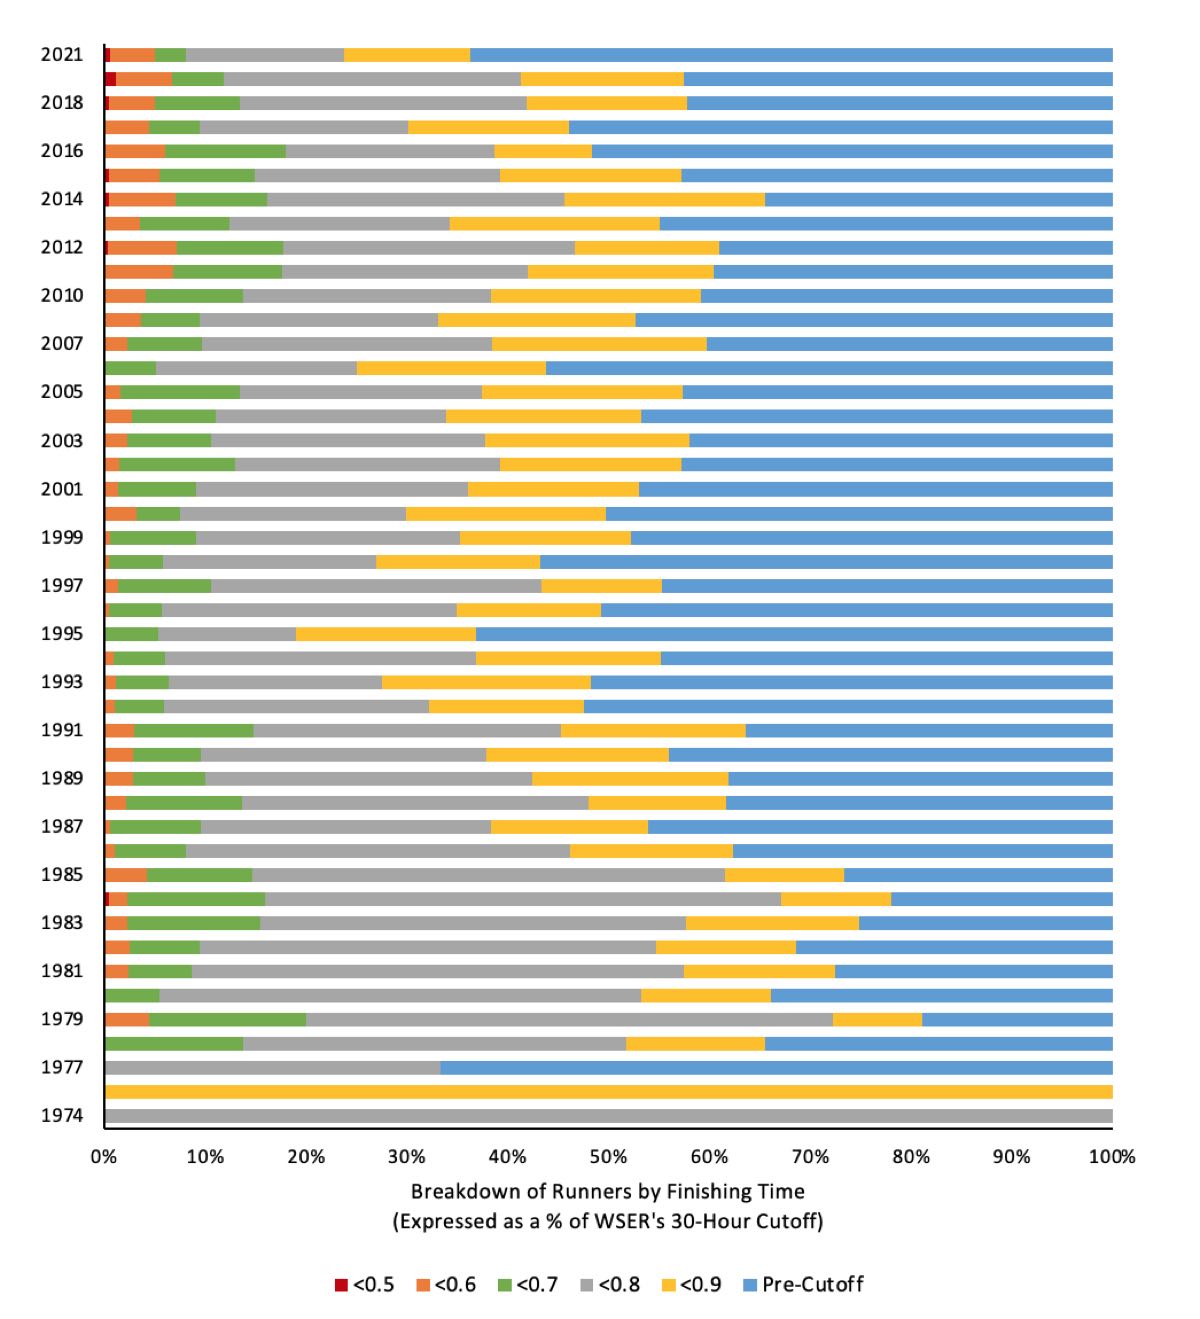
In the bar charts below, I calculated every runner’s finishing time as a percentage of the 30-hour time limit that every runner has to finish the race. I then assigned runners into groups based on their finishing time. If runners as a whole are getting faster, then runners who finish with a few hours to spare of the cutoff time should be shrinking as a proportion of all finishers.
As you’ll see in the charts, there isn’t a consistent pattern. Considering the majority of Western States participants gain entry to the event via a lottery and the undeniable impact of weather conditions on finishing times, it isn’t surprising that the relative speed of the field changes from year to year.
Kuni Yamagata, at 68 years old, was the oldest male finisher of the 2021 Western States 100. Photo: iRunFar/Alex Potter
Distribution of Women’s Finishing Times
Distribution of Men’s Finishing Times
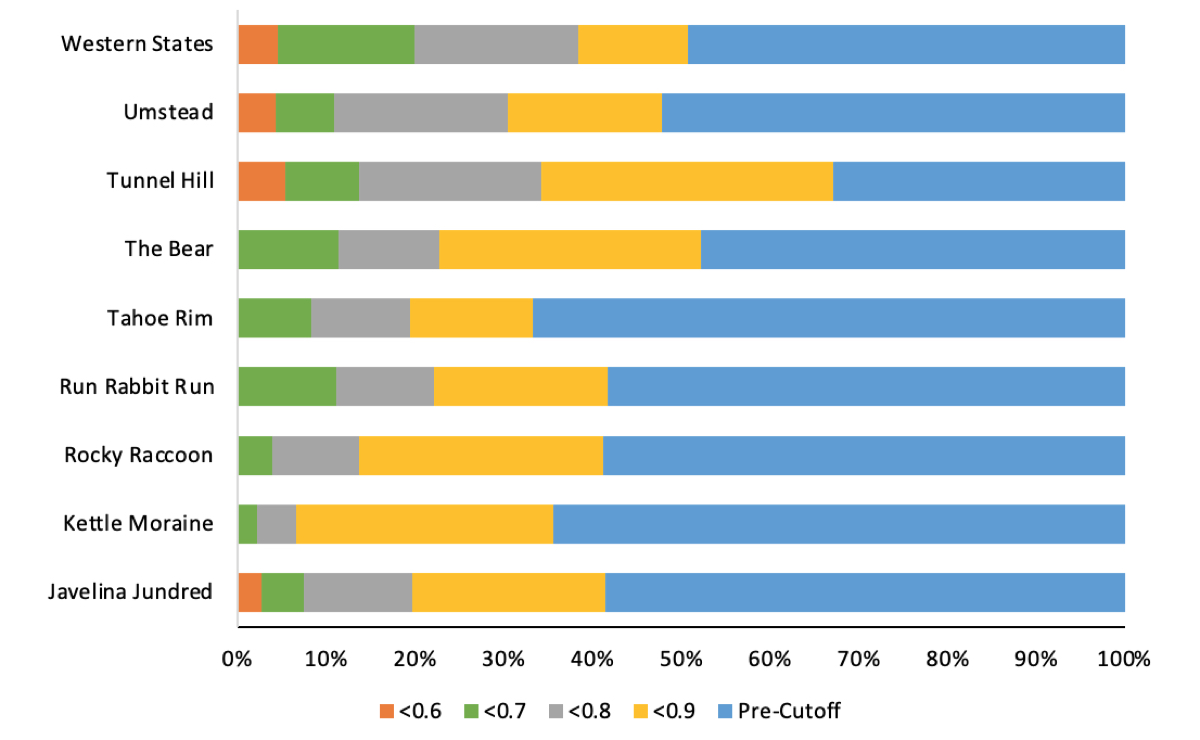
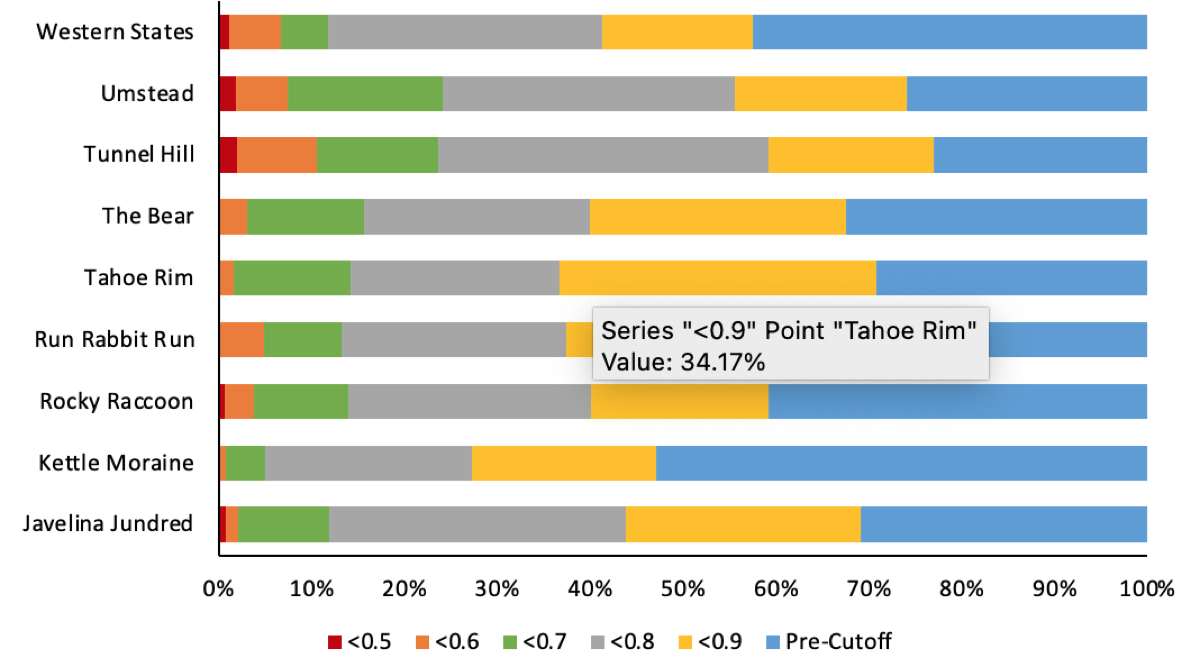
Out of sheer curiosity, I also compared the composition of Western States finishers to some other American 100 milers that also draw larger crowds. I chose 2019 as my point in time to compare results, figuring that as the last full calendar year before the COVID-19 pandemic, it is the most recent year that represents a normal season of racing.
I chose 100 milers that were rated extra-large or large events in the UltraRunning Magazine race calendar, with a preference for those that listed their results on UltraSignup because that saved me time organizing and standardizing the data.
When you look at the graphs below, take note of the general proportions of finishers who are using 80% or 90% or more of the available time to complete the race. When those proportions are large, it suggests the race may be less competitive, and/or it is a challenging race. When there are several runners finishing the event in less than 60% of the available time, that suggests the race attracts a competitive field, and/or has generous time cutoffs.
Distribution of Women’s Finishing Times at Selected Large U.S. 100 Milers in 2019
Distribution of Men’s Finishing Times at Selected Large U.S. 100 Milers in 2019
Final Thoughts
If you, like me, love data, then this is a fascinating way to gain a deeper appreciation for the Western States 100. And if you’re one of the fortunate runners who will be racing this storied event in its 2022 edition, good luck! Go out there and give it your 116%.
Call for Comments
- What do you think of the Western States 100’s growing competitiveness? What aspect of this growth do you particularly notice?
- If you enjoyed this data deep dive, leave a comment to let us know what element of our sports you’d like to see an analysis of next!

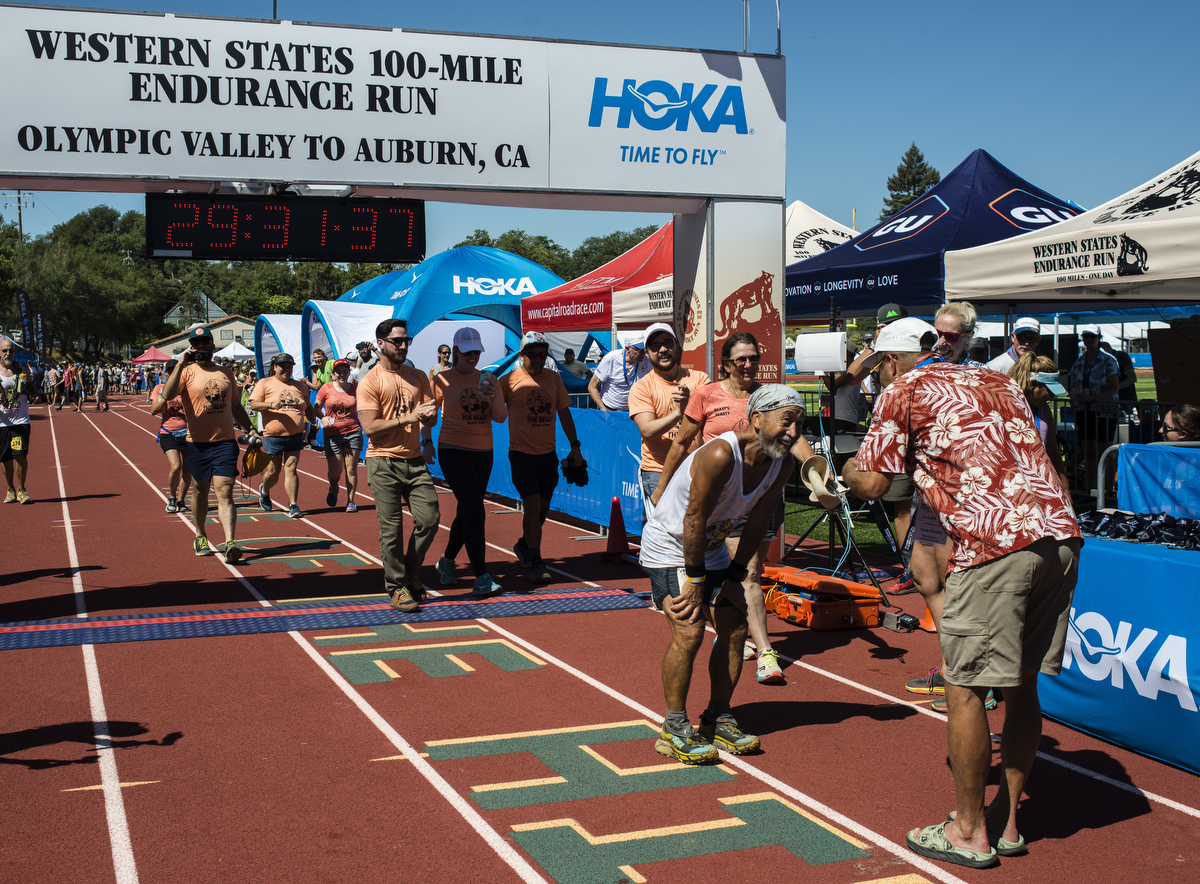
Gunhild Swanson after finishing the 2015 Western States 100 in 29:59:54, six seconds before the race cutoff at 70 years of age. Photo: iRunFar/Bryon Powell
