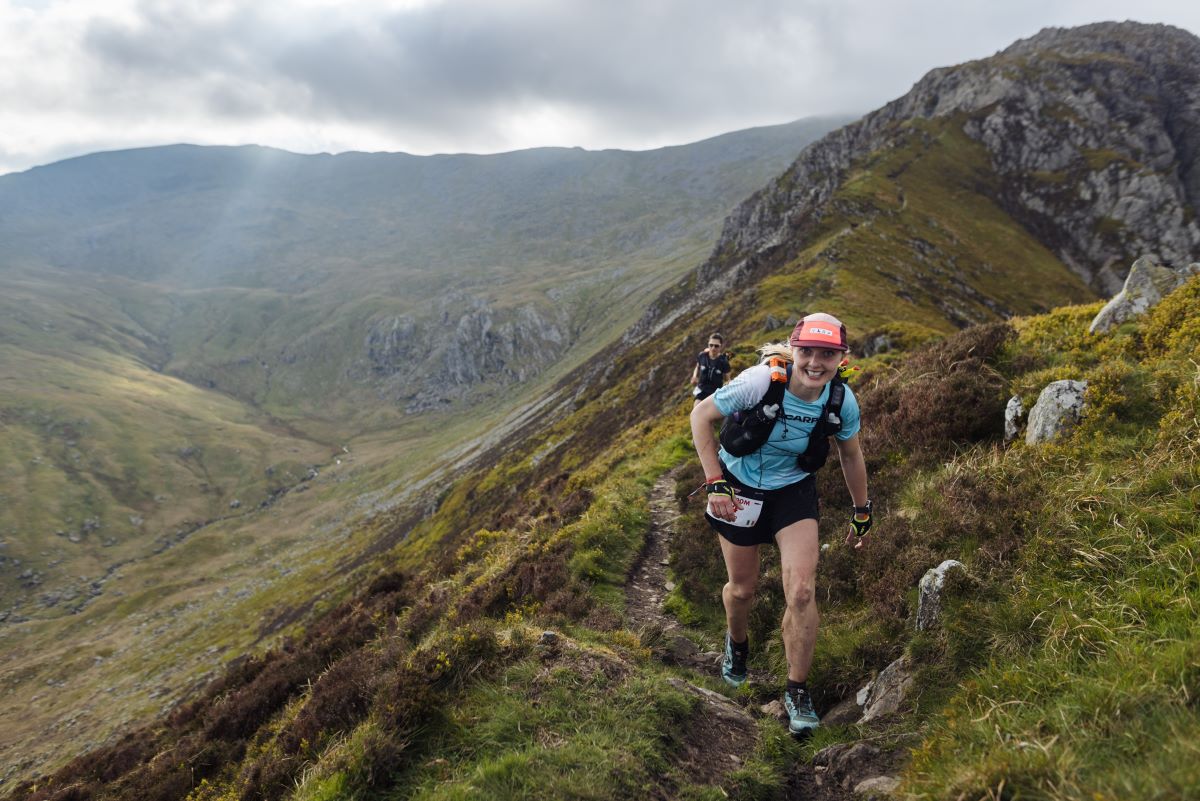
Some friends and I made the road trip to the 2016 Bighorn Trail 100 Mile, and we all received shirts with the course profile on the back. When one of my friends returned home with the shirt and a since-avenged DNF, his sons liked to point at the highest peak on the course profile and say: “This is where you failed.” I think they were onto something — in addition to just being hard on their dad — so let’s try to pinpoint what goes into a DNF.
“Did not finish” (DNF) is an outcome that runners generally want to avoid, so it can be useful to understand where the risks of getting a DNF are higher. Are there particular characteristics a race might have that will drive up the DNF rate? Are there points in a race where a DNF is more likely? Strap in for a journey of discovery.
[Editor’s Note: We kindly remind readers that the Running the Numbers column is a just-for-fun analysis. While we always endeavor to analyze accurately, we limit the scope of each article in order to make the work doable for author Mallory Richard, and the results digestible for readers like you.]

Jim Walmsley (left) ending his day at the river at the 2017 Western States 100, showing that no one is immune to the occasional DNF. Photo: iRunFar/Bryon Powell
The Methodology
This article draws on two datasets: one composed of results from 25 races, and a smaller dataset with 10 years worth of splits for a particular race. For both datasets, I controlled for distance by focusing on 100-mile races. Please don’t take that as a snub against other race distances — we love all distances but have to create data boundaries somewhere.
For the dataset composed of results from 25 races, I intentionally chose races with some variety in their locations, terrain, elevation, and start times (1). My dataset is still admittedly small, because it’s comprised of just 25 races and only their results from 2023. Still, it’s a good starting point for a just-for-fun analysis that gives us something to discuss with our friends on the next long run. I selected races that were:
- Part of the World Trail Majors
- Part of the UTMB World Series
- On “UltraRunning Magazine’s” list of the largest North American ultras in 2023, and/or
- Events I’ve run personally and I wanted to show them some love
The DNF rate for each event was calculated by dividing the number of runners who DNFed by the number of participants who started the race. Runners who did not start therefore do not factor into the DNF rate.
Do Certain Factors Impact DNF Rates?
Rather than keep you in suspense, I’ll tell you right now: “being the 2023 Western States 100” was the only factor that had a discernible impact on DNF rates in this particular dataset. In 2023, over 85% of runners who started the Western States 100 crossed the finish line in time to receive their belt buckle. The percentage of runners who got a DNF was 13.5%. That was an unusually high finisher rate: for the previous 20 editions of the race, the average DNF rate was 27%.
The 2023 edition of Western States was considered a particularly mild in terms of the weather forecast. There may be other factors that give the event a higher finisher rate (and lower DNF rate) than some other 100 milers.

Jennifer St. Amand, the final official finisher of the 2023 Western States 100, who beat the cutoff by 21 seconds. Photo: iRunFar/Sarah Brady
For example, Western States requires runners to qualify to run the event. The challenges of gaining entry to Western States also mean runners have no guarantee of being able to try again next year — or ever — so the runners fortunate enough to start the race will be particularly motivated to train well.
Finally, Western States maintains a waitlist, so runners who believe they won’t finish the race have the option of making another runner’s dream come true by withdrawing from the race in advance, so another runner can have the opportunity instead.
Through some combination of these factors, participants in the 2023 edition of Western States collectively crushed it.
Beyond this observation, there were no obvious or statistically significant trends among any of the factors I examined. While the races in the dataset had some notable differences among them, most had DNF rates within a particular range. The average DNF rate in the limited sample dataset was 38%, and you’ll see in the distribution chart below that most races had DNF rates in that ballpark.
Distribution of DNF Rates Among the 25 Races in the Sample Dataset

Chart showing the distribution of DNF rates among the races examined.
DNF Rates by Total Elevation Change
There is no compelling or statistically significant trend in how elevation change impacted the DNF rate in our dataset.
For example, the Ultra-Trail Snowdonia by UTMB 100 Mile had the highest DNF rate in 2023 of races in the dataset, at 59%, and had about 31,000 feet (9,500 meters) of elevation gain. It eclipsed the Ultra-Trail Kozciuszko by UTMB 100 Mile in both respects, as that race had just 16,400 feet (5,000 meters) of elevation gain and a DNF rate of 31% in 2023.
But there are both mountainous and comparatively flat or hilly races within the 30 to 49% range for DNF rates.
Female winner Emma Stuart on the course of the 2023 Ultra-Trail Snowdonia by UTMB 100 Mile. Technical terrain as well as a lot of elevation gain likely contributed to the race’s high DNF rate. Photo: Guillem Casanova/UTMB
Correlation between DNF Rate and Total Elevation Change for Each Race

Scatterplot showing the correlation between DNF rates and total elevation change.
DNF Rates by Time Cutoff
Affording runners more time to cover 100 miles doesn’t seem to be a surefire way to reduce DNF rates. A 30-hour cutoff was the smallest amount of time races in this dataset offered for runners to reach the finish line. Among the races with that cutoff in this dataset — the South Downs Way 100 Mile, Western States 100, Hennepin 100 Mile, Javelina 100 Mile, Rocky Racoon 100 Mile, and Leadville 100 Mile — the DNF rate ranged from 13% right up to 56%.
Correlation Between DNF Rate and Time Cutoff for Each Race

Scatterplot showing the correlation between DNF rates and time cutoffs.
DNF Rates by Race Start Time of Day
In pre-race interviews for UTMB, North American athletes will sometimes refer to the challenge of racing an ultramarathon with an evening start. While the UTMB begins at 6:00 p.m. local time, the Rocky Racoon 100 Mile, for example, starts at 6:00 a.m.

The start of the 2017 UTMB. Many runners find the 6 p.m. start to be a challenge. Photo: Kirstin Kortebein
Early start times were fairly common among the North American races in this dataset — though much respect to the Black Hills 100 Mile for letting runners sleep in before their comfortable 10:00 a.m. start time.
While individual runners are likely to have opinions on the ideal time of day to start a 100-mile race, the dataset did not suggest that start time has an impact on DNF rates.
Correlation Between DNF Rate and Start Time for Each Race

Scatterplot showing the correlation between DNF rates and start times.
Whither the DNF?
I was curious to know where the “danger zone” for dropping from a race might be, so I pulled up the splits for the Superior Fall Trail Race 100 Mile. I chose this race because it’s a personal favorite, and the race director publishes the race splits in a consistent and accessible format. The 103-mile course is more challenging in the second half, with the most technical terrains and largest climbs concentrated in that portion.
I would love to expand upon this analysis in a future column and incorporate data from more races, but the data from the Superior Fall Trail Race 100 Mile confirms what I’m sure you intuitively suspected. You are most likely to DNF your 100-mile race during that section of the race when your legs are tired, but you still have many miles to cover.
I counted all of the DNFs, by aid station, for this race for the years where splits are available online — 2014 to 2023. I plotted them in the chart below to show the points in the race that have the largest proportion of all DNFs.
As a technical note to my fellow superfans of this event, because runners are strongly discouraged from dropping out at the remote Sonju Lake Road aid station and timing data is often unavailable for that aid station, I combined any known DNFs for Sonju Lake Road with the DNFs at the next aid station, Crosby-Manitou at mile 62.9.
Also note that all DNFs for this race are marked to have occurred at aid stations.
DNFs at the Superior Fall Trail Race 100 Mile, From 2014 to 2023, by Mile/Aid Station

Graph showing where DNFs occurred at the Superior Fall Trail Race 100 Mile, from 2014 to 2023.
But Why Did They DNF?
Results and splits only tell part of the story when it comes to a DNF. To really understand why runners DNF, we need to look at the qualitative data as well.
To the relief of Instagram ultrarunning meme account @yaboyscottjurek, we don’t need to read a bunch of nine-part race recaps on Instagram to understand the reasons runners don’t finish a 100 miler.
The American Trail Running Association (ATRA) conveniently aggregated the experiences of roughly 1,200 survey respondents in a 2022 article on the topic. ATRA’s survey provided runners with a list of reasons they might DNF a trail race of any distance, and runners could select all of the reasons that contributed to any of their past DNFs. You can see the results in the table below.

Results of a survey by the American Trail Running Association about why people choose to DNF a trail race.
Closing Thoughts
We may revisit this topic again in a future column, because there are more questions I would like to answer. For example, are DNF rates impacted by whether:
- Runners need a qualifier to get into the race?
- The race is more or less competitive?
- The race is a bucket-list type race with a hard-to-enter lottery or significant and expensive travels to?
- Races that attract more “repeat offenders” have lower DNF rates, perhaps because more participants have prior experience with the course?
- There are particularly difficult weather or course conditions, like high heat, a big storm, or excess snow or mud?
- The race is long or short?
Additionally, I would love to know if there is a particular time of day when runners are most likely to DNF, such as overnight or perhaps in the heat of the day.
I imagine many readers are interested in DNFs for the same reason I am: We prefer to finish our races. We hope that by understanding DNFs, we reduce the likelihood of it happening to us.
While I can’t imagine many — if any — runners start a 100-mile race with the intention of getting a DNF, ultrarunner, race director, and podcaster via the business Ten Junk Miles Scott Kummer reminded me that the DNF represents an essential aspect of the ultramarathon.
I asked him about the DNF rate for the Badger Trail Race 100 Mile, which he organizes. With 18 aid stations and a 38-hour limit to cover 100 miles on relatively flat rail trails, it’s an event that we have previously described as “finisher-friendly.” The race still had a 26% DNF rate in 2023 — 34 DNFs among 133 participants — which puts its DNF rate within the same range as the events we examined above.

Bertha Lotje Woehl, pacer Clara Beaudet, and aid station Captain Holly Lindroth at the 2021 Badger Trail Race 100 Mile. The race is known for its generous cutoff times. Photo: Will Harrison
But, as Kummer pointed out, some of the runners attracted to the Badger Trail Race 100 Mile specifically choose that race over other ultramarathons because their chances of finishing an event with less generous cutoffs on more technical trails are too low.
Regardless of the event or the terrain, many runners are drawn to events where they have a legitimate chance at reaching their goals, but they are challenged enough that getting a DNF remains a distinct possibility.
Speaking for myself, this is a useful reminder. When life gets busy and training falls by the wayside, it’s easy to get anxious about the increasing odds that I won’t attain my race goals. Studying DNFs helps me make peace with my own, and gives me a deeper appreciation for how the entire point of training for a challenging race is to spend time pushing the limits of our potential, while repeatedly coming to terms with those limits.
It applies to life outside of running, too. Heck, I technically DNFed this article because I missed a time cutoff for providing it to my editors and I still need to tell you about…
Call for Comments
- Do you consider the percentage of runners who DNF when judging a race’s difficulty?
- What is your personal experience with DNFs?
- We may have to take another look at DNFs in the future. What other trends would you like to dig into?
Notes
- In alphabetical order, the 25 races (all 100 milers) are: Bighorn Trail, Black Hills, South Downs Way, Doi Inthanon Thailand by UTMB, Grand Raid des Pyrénées, Grindstone by UTMB, Hennepin, Istria 100 by UTMB, Javelina, Julian Alps Ultra-Trail by UTMB, KAT100 by UTMB, Kullamannen by UTMB, Leadville, Mountain Ultra-Trail by UTMB, Nice Côte d’Azur by UTMB, Québec Mega Trail, Rocky Raccoon, Run Rabbit Run, Superior Fall Trail Race, Trail Alsace Grand Est by UTMB, Ultra-Trail Cape Town, Ultra-Trail Kosciuszko by UTMB, UTMB, and Western States.
