[Editor’s Note: Welcome to a limited-series column by runner and data analyst Mallory Richard where we dive into data from the sports of trail running and ultrarunning to look for trends, see our sports’ progression through time, and have fun playing with numbers.]
This month’s article started as a fun challenge from iRunFar’s own Editor-in-Chief Bryon Powell: the summer months are chock-full of hilly and mountainous trail races. What does the data tell us we can expect from our upcoming uphills?
Like many data analyses, this proved to be less about the analysis and more about the wrangling. I needed to create a dataset that controlled for distance; after experimenting a bit, I settled on 50-kilometer (31-mile) races. I needed to control for altitude, so I checked the starting point of each potential race and only included those within approximately 500 meters (1,600 feet) of sea level.
To avoid comparing rugged skyrunning races to flat rail trails, I only included races that “UltraRunning Magazine” gives a surface rating of 1, 2, or 3 (or races where I and others confirmed the terrain would receive such a rating). I used North American races because it was easier for me to track down results and elevation profiles.
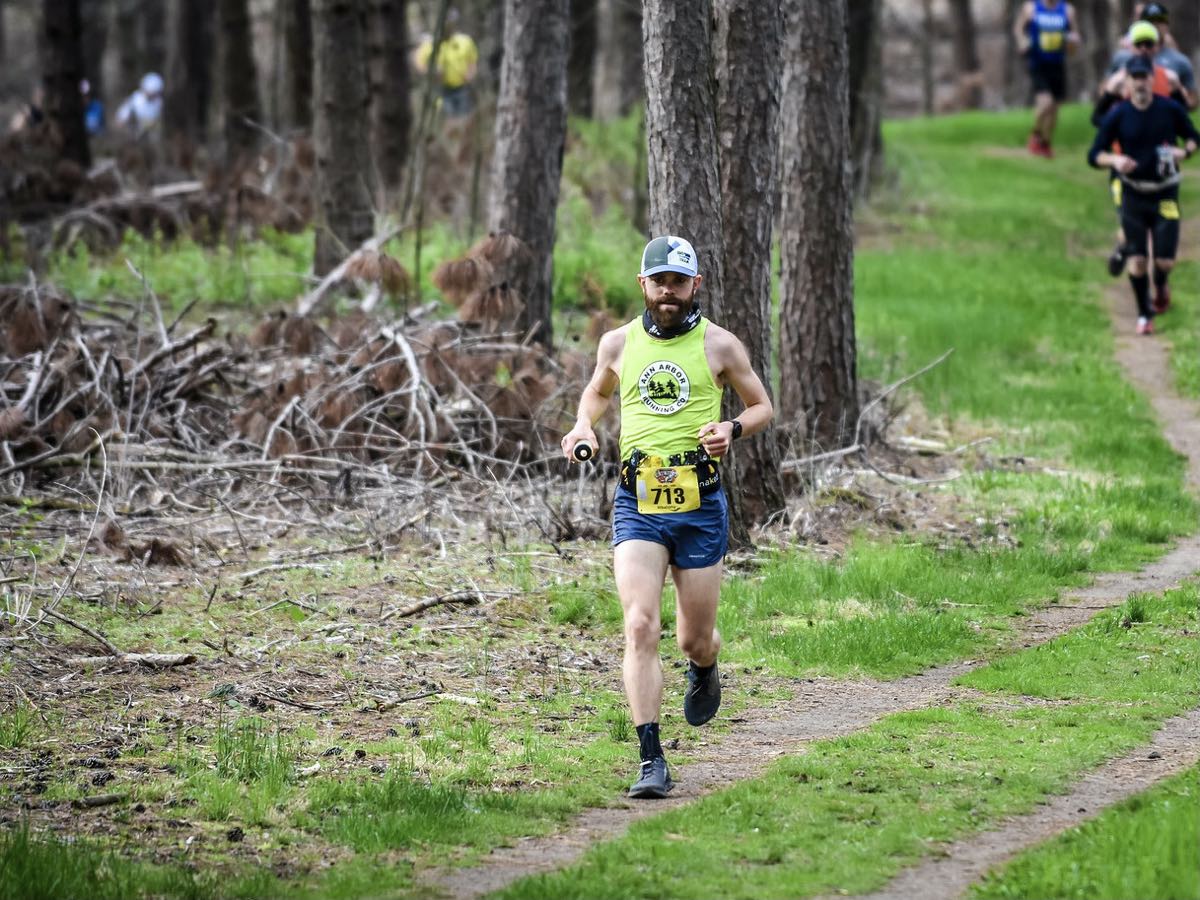
Mikel Haggadone running flat trails at the 2019 Ice Age Trail 50k. Photo: Mile 90 Photography
Then I had to organize the data and make it readable. To put it mildly, that took a while.
But I persevered and am proud to present to you the following graph.
Median 50k Finish Times in Relation to Race Elevation
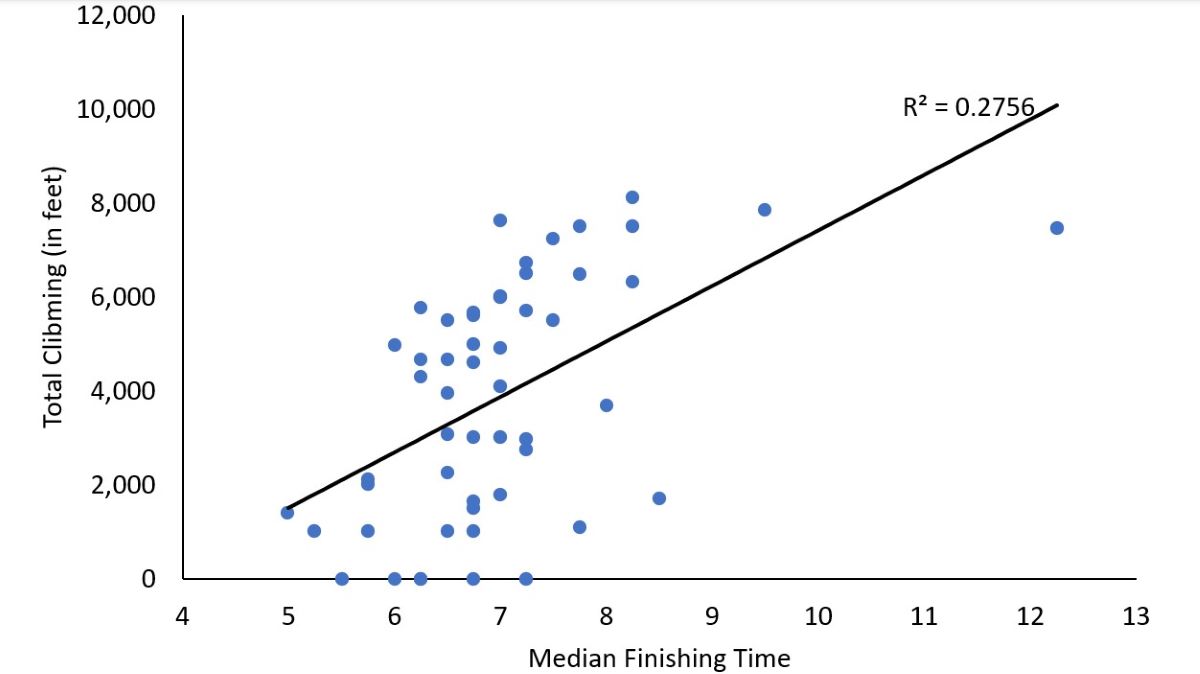
This is a regression analysis that plots a race’s median finishing time against its net uphill (in feet). Each data point represents one of 57 races in my dataset (1).
The trend line indicates that, unsurprisingly, hillier races have greater median finishing times. Put simply: more climbing equals slower running.
The correlation in my dataset is weak, though. Despite repeatedly going back to find more races, my trend line has an R-squared value of 0.28. That number, also known as the coefficient of correlation, suggests that the variable of elevation does correlate to slower finishing times. But the correlation is not strong enough for us to say that the total climb in a 50k race can singlehandedly explain why, for example, the median finishing time for the Hennepin 50k is faster than the median time at Sean O’Brien 50k.
Before you infer I’m a lousy analyst for failing to conclusively prove that hills slow you down in ultras, a few considerations:
- Some races are more competitive than others. For example, the Bandera 50k is a hilly race, but its top finishing times are faster than some smaller 50k races that happen on flatter courses. Please note I didn’t include Bandera in the linear regression above, because it is too technical to be compared to those races.
- Cutoff times affect finishing times. Races with aggressive cutoffs could trend toward faster finishing times because it’s literally impossible to run a slower time and get an official finish. In contrast, races with generous time cutoffs may attract runners who know that they can finish the event even if they do substantial hiking or have a rough day.
- Temperatures and ground conditions affect how one race compares to another, and even impact finishing times year-over-year at the same event. This is why iRunFar’s annual coverage of Western States 100 talks so much about temperatures on race day and the presence (or not) of snow in the high country.
How does this apply to you? At a minimum, it can be helpful to temper expectations about how much faster you’ll be at your next flat 50k trail race, or to plan for many hours on-course in your next mountain ultra.

Anna Mae Flynn pushes uphill at the 2019 Lake Sonoma 50 Mile. Photo: iRunFar/Bryon Powell
On top of that, you can consider the table below as food for thought when predicting your finishing time at an upcoming 50k, based on where you tend to finish in the field (overall) and how much elevation your race will have.
Predicted 50k Finish Times in Relation to Elevation Gain in Race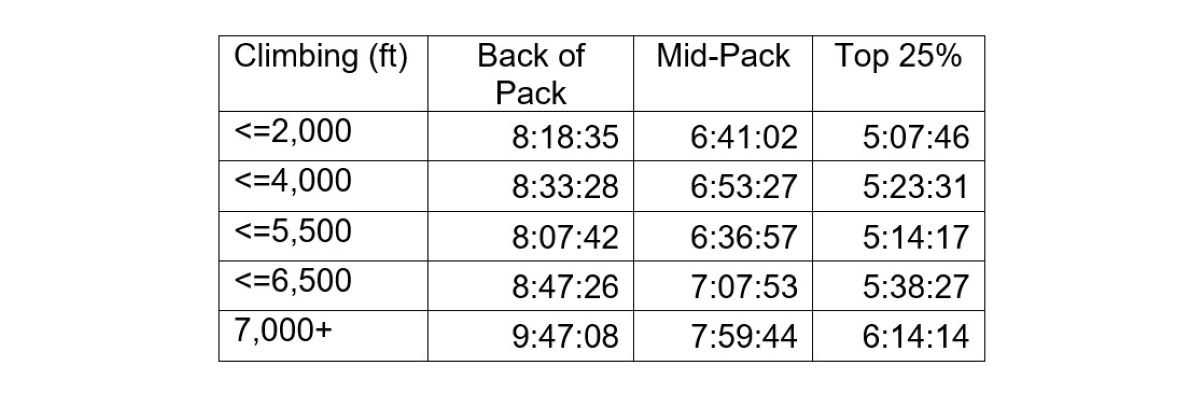 The real gold, though, is the dataset I created. If you’re a numbers person, you can skip the data wrangling and jump straight to finding exciting insights of your own. You can find a copy of the spreadsheet in this Google Drive folder, or extract it from this Tableau Public dashboard that anyone can use.
Conclusion
After collecting over 20,000 race results for over 50 events, along with altitude and elevation profiles, what gem of wisdom can I offer? Yeah, hills slow you down some.
Call for Comments
- Do you try to predict your finishing times for races where you’ve never seen the course before? If so, how do you make your predictions?
- Did you look through the data for yourself and find anything interesting?
End Note
- These races were: Afton, Algonquin 50k, Angeles National Forest, Avalon Benefit, Badger Mountain Challenge, Beaver Flat 50, Berkeley Trail Adventure, Bigg Butts, Blues Cruise, Booneville Backroads Ultra, Cinderella Trail – Spring, Dahlgren Heritage Trail, Diez Vista, Elk/Beaver Ultra, Epic East Gate, Fall Back into the Trails, Finlayson Arm, Fort Ord Trail Run, Gate2Gate, Ghost Train Trail Races, Golden Gate Trail Classic, Green Lakes Endurance Runs, Habanero Hundred, Haliburton Forest, Hennepin, High Bridge Ultra, Ice Age Ultra Trail, Jarmans, Kettle Moraine, Lake Sonoma, Lost Lake, Mission Tejas Trail Run, Muleskinner Endurance Runs, Nashville Ultra, New Orleans Ultramarathon, Norris Dam Hard Trail Race, Oxbow 50k, Priest Lake, Pumpkin Holler, Race the North Face, Rock the Ridge, Rocky 50, Rodeo Beach, Rodeo Valley, Run Woodstock, Sean O’Brien, Skyline 50, Sulphur Springs, TARC Fall Classic, The North Face Endurance Challenge, Tiger Mountain Trail Run, Vermont 50, Wallace Falls Trail Run, Waterfalls 50k, WC-50 Ultra Trail Marathon, and Yippee-Ki-Yay.
