The 200-mile race season is upon us! It is that time of the year again when 200-mile — and longer — races capture the imagination of trail runners around the world. In reality, the 200-mile race phenomenon is now global, with events of this distance happening almost every month of the year.
But with the 2026 Arizona Monster 300 Mile recently finished and the Cocodona 250 Mile nearly upon us, we’ll take some time to reflect on the state of races in the 200-plus-mile range, look at their growth over the past few years, examine the types of people who are running them, and explore how fast they are running.

Rachel Entrekin, the 2025 Cocodona 250 Mile women’s winner and course record holder. Photo: iRunFar/Bryon Powell
Growth and Logistics of 200-Mile Races
The idea of racing a really long way is not new; the concept of pedestrianism — running nonstop for one, three, and six days — dates back to the 1800s, though these events focused on running for a specific length of time rather than distance. Some of the earliest adopters of nonstop races over the 100-mile distance were the McNaughton (now Potawatomi) Trail Runs in Illinois, which offered a 150-mile race starting in 2007, the Tor des Géants in Italy, ranging at 205 miles starting in 2010, and the 268-mile Spine Race in the U.K., in 2012.
The Tahoe 200 Mile, held in California and Nevada, began in 2014. It was joined by Washington state’s Bigfoot 200 Mile in 2015 and Utah’s Moab 240 Mile in 2017 to create what’s called the triple crown of 200-mile races put on by event company Destination Trail. Then the Cocodona 250 Mile leaped onto the scene in 2021, followed by several other successful events in recent years, such as the Mammoth 200 Mile and the Arizona Monster 300 Mile, both in 2025.
There is clearly a demand for this event style, and it is gaining a passionate following. It takes so much effort to put on an event of this scale that the community energy around it is often as oversized as the race distance. Though this race distance is globally popular, for the purposes of this article and to keep data manageable, we’ll focus on North American races 200 miles or longer.
Looking at finishers of 200-plus-mile events in North America, we see rapid growth over the past couple of years.
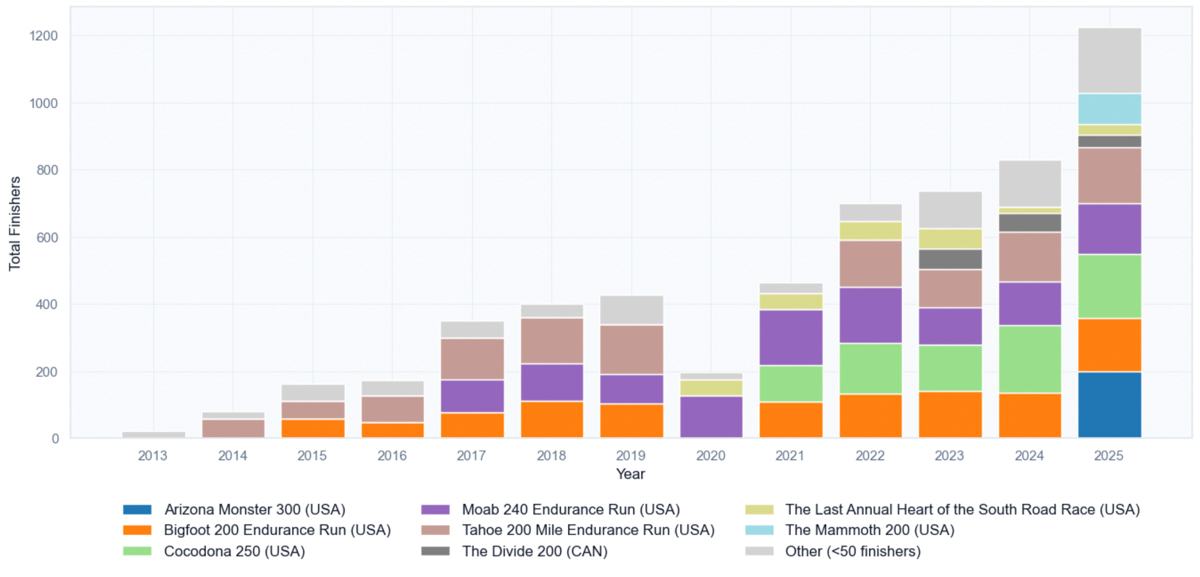
The growth of 200-plus-mile races over the past 12 years. All graphs by Zander Chase.
While more people are participating in these events, relatively few organizers are stepping up to organize them. Besides Destination Trail, which hosts Bigfoot, Tahoe, Moab, and the Arizona Monster, the other main races that have launched successfully have been put on by Aravaipa Running and Mammoth Trailfest, both organizations with strong existing race logistics networks and community support.
These longer races present significant operational complexity, creating a high barrier to entry for event organizers. In contrast to 100 milers, where cutoffs are generally around 1.5 days, 200-plus milers scale significantly, with cutoffs that can exceed seven days. This increase in time and the variation in when runners arrive at aid stations require staff and volunteers to be on course for days on end.
See below a visual from the Mammoth 200 Mile runner guide that shows how this time variability scales up when staffing aid stations along the course.
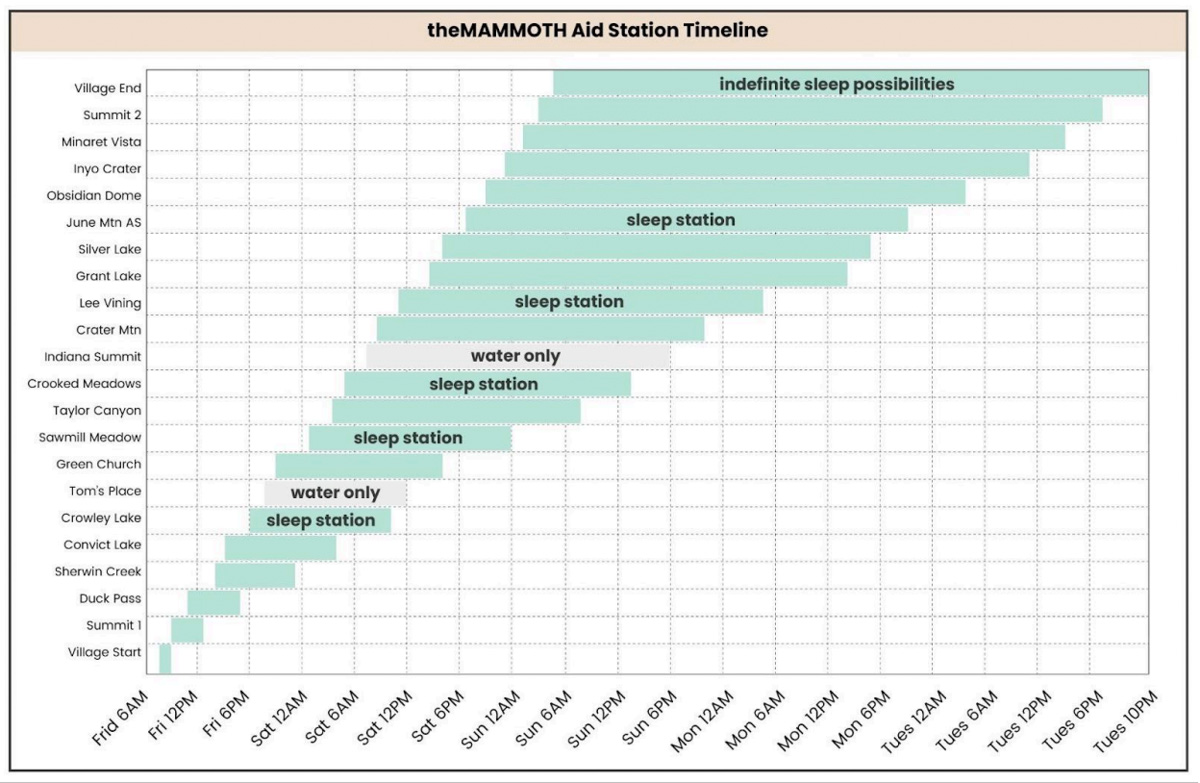
The aid station chart for the 2025 Mammoth 200 Mile. Image from the Mammoth 200 Mile runner’s guide.
Demographics Data of 200-Mile Race Participants
So who the heck is running these 200-plus-mile races in North America?!
For this article, we pulled data from 2021 to 2025 for the Cocodona 250 Mile, Tahoe 200 Mile, Bigfoot 200 Mile, and Moab 240 Mile. These four events have consistently been the most popular 200-plus-mile races in North America over this span. Our hope was to build a large enough dataset from events of similar scale and style to gain interesting insights into the demographics of those who run these races. All the data is pulled from the DUV Ultra Marathon Statistics database and focuses on participants who finished the event and had their time recorded.
Gender
We see a 76% to 24% split of men to women in the 200-mile races examined. There are many factors that go into this imbalance, both at the 100-mile and 200-plus-mile distances. Like many race organizations taking steps to increase female participation — the High Lonesome 100 Mile offers an equal number of lottery spots for men and women — the Cocodona 250 Mile has created a lottery system similar to that of the Hardrock 100, where the number of men and women selected for the race is based on numbers in the lottery pool.
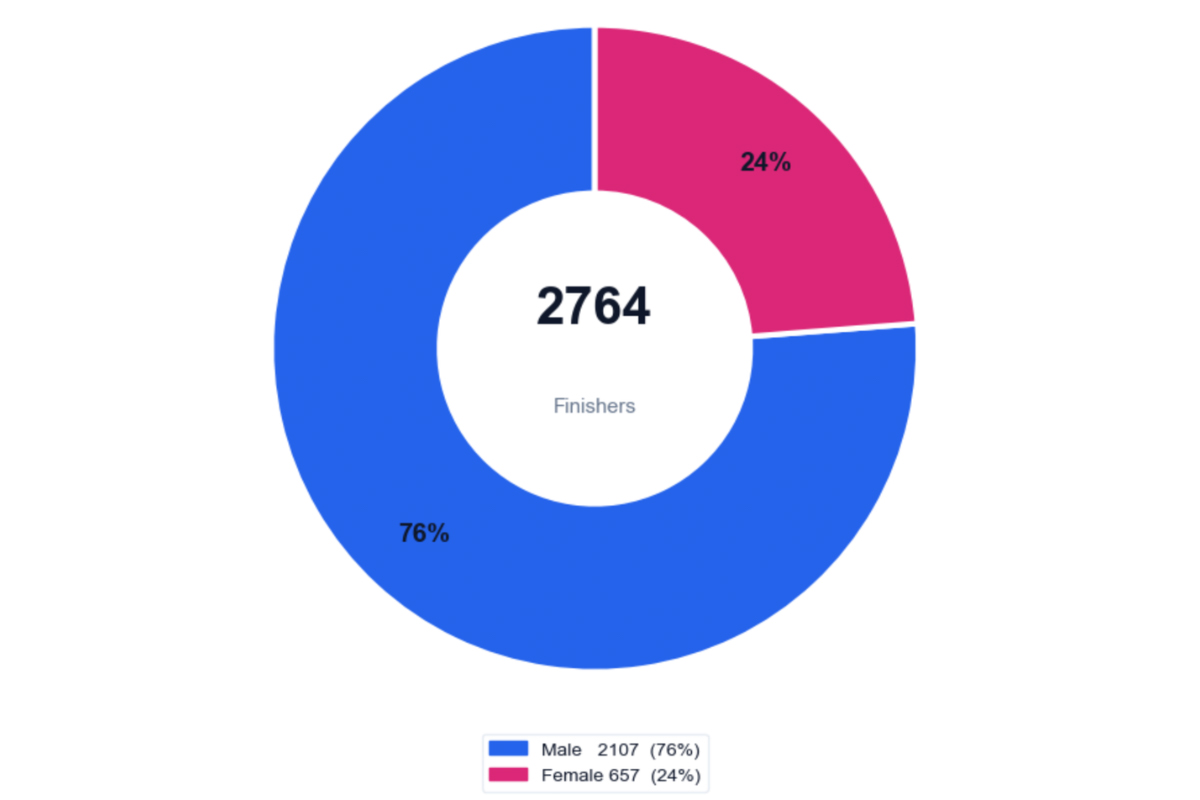
The gender distribution of finishers of the included 200-plus-mile races. Photo: Zander Chase
Age
Next, we examine the ages of participants in 200-plus-mile races. You may not be past your prime for this distance! For this, we grouped people into age buckets. An age bucket includes the age it shows and extends up to the start of the next bucket. If we look at the most popular age bucket, we can see it is 40, which includes runners aged 40 to 44 at the start of the race.
These races are expensive to enter and require a reasonable amount of disposable income to complete, including travel, lodging, crew, and more. We could speculate that the center of the bell curve — ages 35 to 50 — represents the overlap of those with the funds to pay for and the physical fitness to complete a 200-plus-mile event.
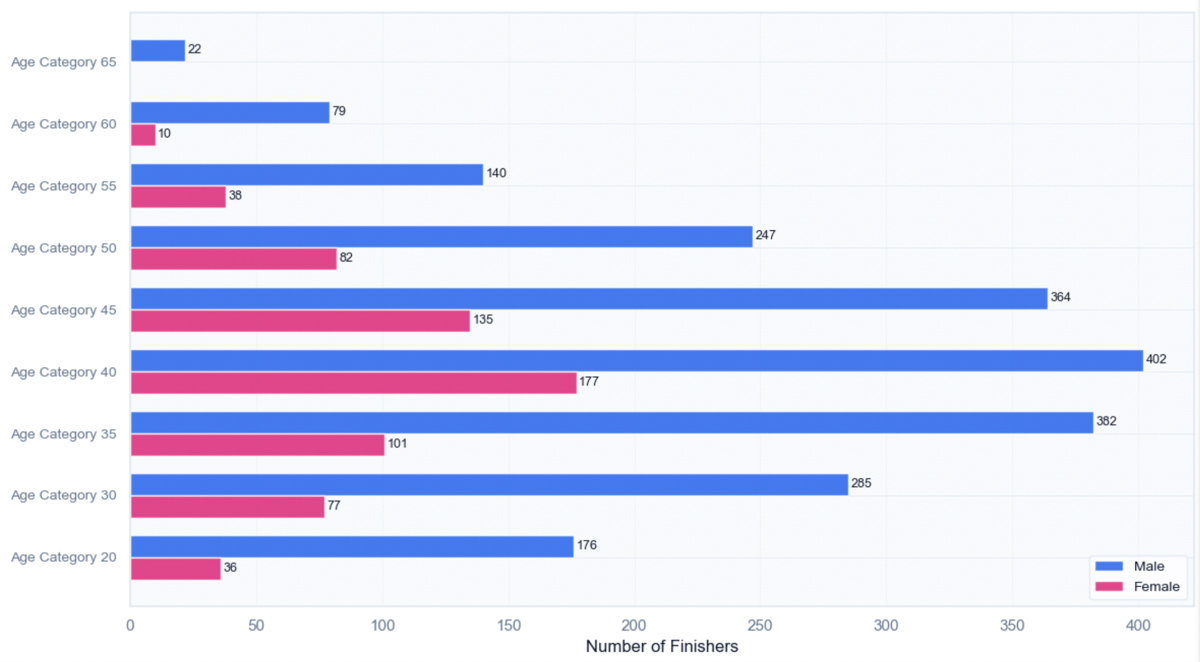
The age distribution of racers in the included 200-plus-mile races.
Speed
How long is it taking these runners to get from the start to the finish? The answer is: a long time. Across all four races in our dataset, the average finishing time for men is 95 hours, and for women, 98 hours, a 3% difference. That’s an average finish time of right around four days — a lot of time to be moving!
Some speedsters push the limits and finish closer to two days, while others stay on course for longer, chasing the cutoffs, which range from 105 hours for the Tahoe 200 Mile to 125 hours for the Cocodona 250 Mile.
We were curious to plot this distribution of finish times to visualize when people crossed the finish line. Since the events are of different distances and with different cutoff times, we focused on the Cocodona 250 Mile for this visualization. For Cocodona, the men’s average finish time is 104 hours, versus 108 for the women. In the graphs below, we can see that both distributions are skewed toward the front of the pack, indicating a few speedy people at the front of the field, followed by a large cluster of folks finishing within one day of the 125-hour cutoff.
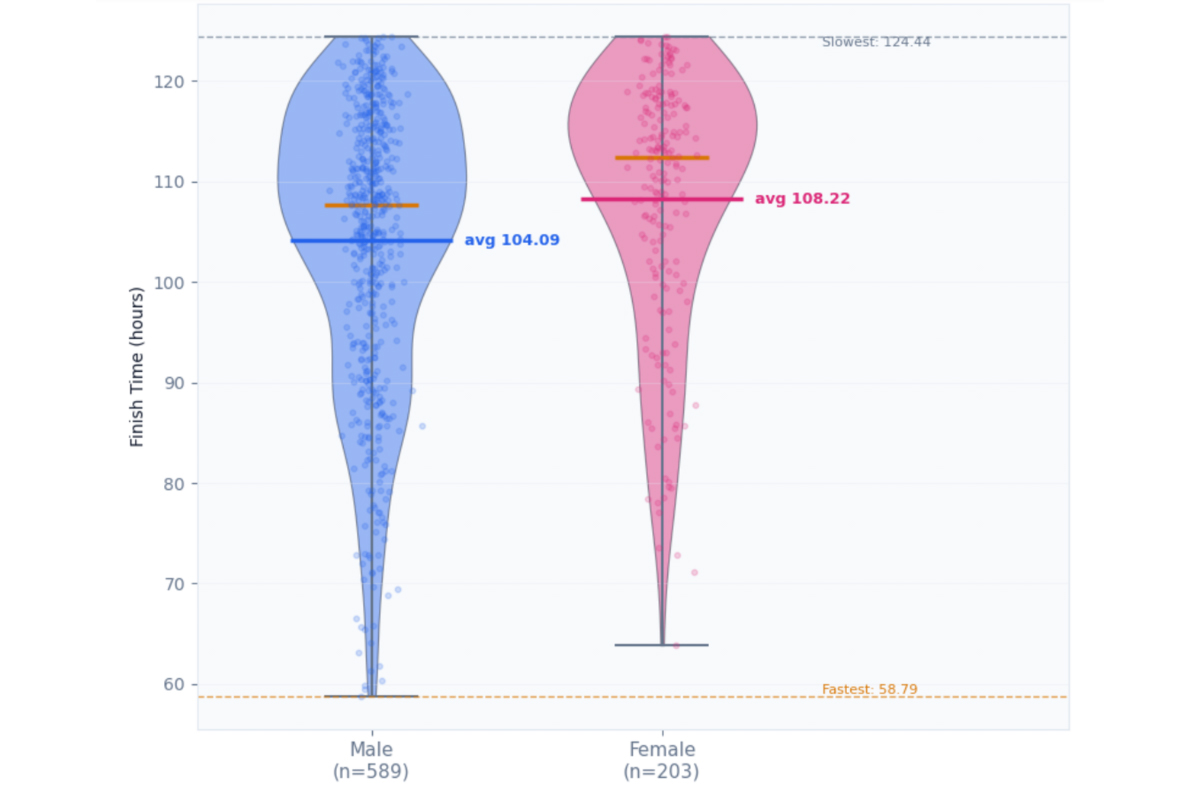
The average finish time for the Cocodona 250 Mile separated out by gender.
Digging a bit deeper into the finisher data, we broke down finish times by gender and age bucket. Looking across all four races in the dataset, we see that the 30 to 34 age range has the fastest average finish time, with it steadily increasing from the 35 to 45 age bucket. There is an interesting plateau between the 45- and 55-year-old age buckets.
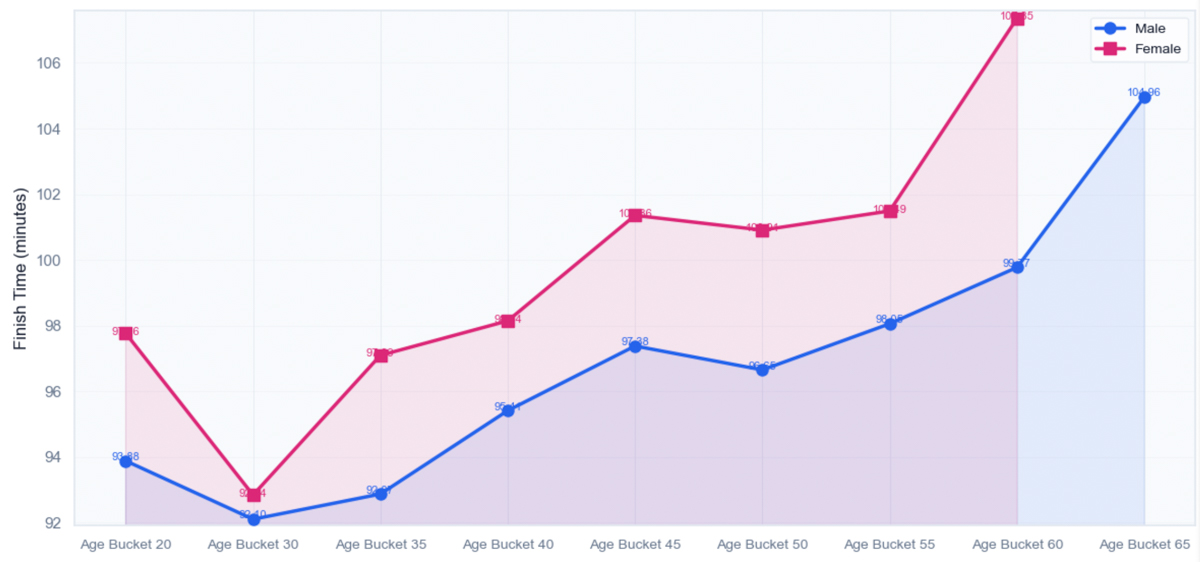
Finish times of the included 200-plus-mile races by age.
If you’re curious to learn more about 200-mile pacing and rest strategies, we previously dug into this concept.
Final Thoughts
Sifting through this data gives us a better insight into the state of 200-plus-mile races and the demographics of the participants. These multi-day events have taken on a life of their own, and it will be fascinating to watch how they continue to evolve.
The beauty of this distance is that, with increased time on foot, comes greater unpredictability and more challenges to problem-solve. We are looking forward to seeing how this year’s 200-mile races unfold!
Call For Comments
- What is the biggest difference you’ve noticed between 200-plus-mile events versus shorter ultra distances, either in observing them as a fan or crew member, or running one yourself?
- What factors are most important for success at this distance?
- What is the most compelling aspect of these multi-day events for you?
